
Mô tả
Chào mừng đến với Economic Calendar ChartAlert!
Mệt mỏi vì phải liên tục chuyển đổi giữa nền tảng giao dịch và trình duyệt web để kiểm tra tin tức? Economic Calendar ChartAlert mang lịch kinh tế toàn cầu trực tiếp lên biểu đồ cTrader của bạn. Được thiết kế dành cho cả nhà giao dịch trong ngày và nhà giao dịch swing, chỉ báo này đảm bảo bạn không bao giờ bị bất ngờ bởi các cú nhảy tin tức có tác động lớn.
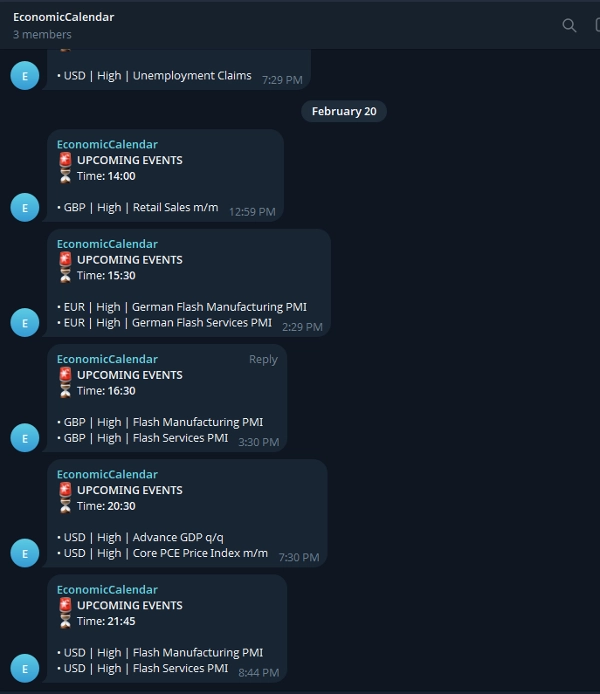
Nó không chỉ hiển thị các sự kiện sắp tới một cách tinh tế trên màn hình của bạn, mà còn có tích hợp Telegram tích hợp sẵn gửi thông báo đến điện thoại/máy tính để bàn của bạn chính xác 1 giờ trước khi các sự kiện quan trọng xảy ra.
Các Tính Năng Chính:
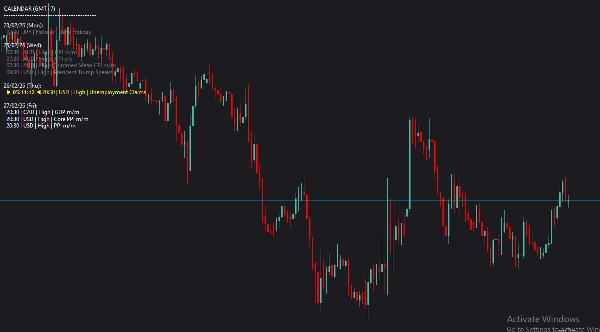
- 📊 Hiển Thị Trên Biểu Đồ: Hiển thị văn bản sạch sẽ, hiện đại và không gây phiền nhiễu sử dụng phông chữ Roboto.
- 🔔 Cảnh Báo Telegram Tự Động: Nhận thông báo trong trò chuyện cá nhân hoặc nhóm trước khi tin tức xảy ra.
- 🎯 Lọc Thông Minh: Chỉ xem những tin tức quan trọng với chiến lược của bạn. Lọc theo các loại tiền tệ hoặc mức độ tác động cụ thể.
- 🎨 Mã Màu Trực Quan: Nhận biết ngay lập tức các sự kiện đã qua, sự kiện sắp tới gần nhất (được làm nổi bật), và các sự kiện tương lai.
⚙️ Hướng Dẫn Cài Đặt & Giải Thích Tham Số
Khi bạn gắn chỉ báo vào biểu đồ, bạn có thể tùy chỉnh các tham số sau để phù hợp với phong cách giao dịch của mình:
Cài Đặt Hiển Thị:
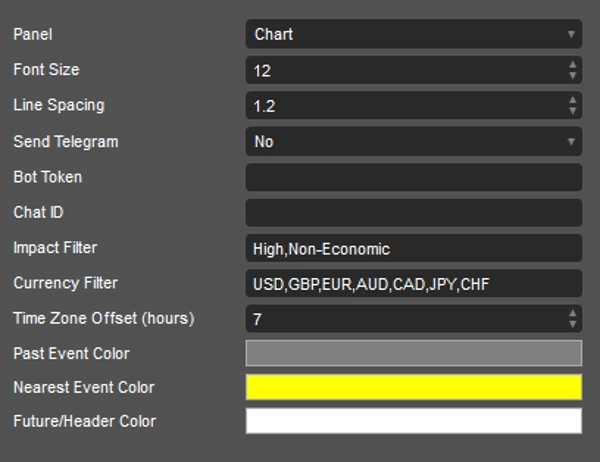
- Kích Thước Phông Chữ & Khoảng Cách Dòng: Điều chỉnh kích thước và khoảng cách của văn bản để đảm bảo nó hiển thị hoàn hảo trên độ phân giải màn hình cụ thể của bạn.
Cài Đặt Telegram:
- Gửi Telegram: Chuyển sang
Yesnếu bạn muốn nhận cảnh báo. (Cảnh báo được gửi khoảng 1 giờ trước sự kiện). - Bot Token: Dán mã API HTTP của Bot Telegram của bạn (được tạo qua BotFather).
- Chat ID: Nhập ID trò chuyện cá nhân của bạn hoặc ID nhóm/kênh Telegram nơi bạn muốn gửi cảnh báo.
Cài Đặt Bộ Lọc (Quan trọng để có biểu đồ sạch):
- Bộ Lọc Tác Động: Gõ chính xác các mức tác động bạn muốn xem, cách nhau bằng dấu phẩy (Mặc định:
High,Non-Economic). DùngAllđể hiển thị tất cả. - Bộ Lọc Tiền Tệ: Xác định các loại tiền tệ bạn đang giao dịch (Mặc định:
USD,GBP,EUR,AUD,CAD,JPY,CHF). DùngAllcho tất cả các loại tiền tệ. - Độ Dịch Múi Giờ (giờ): Điều chỉnh để phù hợp với múi giờ địa phương của bạn. Ví dụ, dùng
7cho GMT+7.
Màu Sắc:
- Màu Sự Kiện Đã Qua: Màu cho các sự kiện đã xảy ra trong ngày hôm nay (Mặc định: Xám).
- Màu Sự Kiện Gần Nhất: Làm nổi bật sự kiện sắp tới tiếp theo để thu hút sự chú ý của bạn (Mặc định: Vàng).
- Màu Tương Lai/Đầu Mục: Màu cho tiêu đề lịch và các sự kiện sắp tới (Mặc định: Trắng).
Giao dịch thông minh, luôn cập nhật thông tin, và để biểu đồ làm việc cho bạn!
Tóm tắt
The indicator features automated Telegram alerts, sending notifications approximately one hour before high-impact events to personal chats or groups via a configurable Telegram Bot. Visual settings allow adjustment of font size and line spacing for optimal display on various monitors. Time zone offset can be set to match local time.
Key functionalities include on-chart event display, smart filtering by currency and impact, color-coded event visualization, and Telegram integration for timely alerts. Supported markets and symbols include Forex, indices, commodities, and cryptocurrencies such as BTCUSD, EURUSD, GBPUSD, USDJPY, and XAUUSD. This tool aids traders in staying informed of critical economic news without leaving their trading platform.
Đánh giá của khách hàng
5 | 100 % | |
4 | 0 % | |
3 | 0 % | |
2 | 0 % | |
1 | 0 % |


![Logo "[Hamster-Coder] Moving Average MTF"](https://cdn.ctrader.com/image/webp/b11b98b1-194d-4b8e-b00e-d611826ad159_31226)


![Logo "[Stellar Strategies] Visual Trend Momentum"](https://cdn.ctrader.com/image/webp/48aee0a5-f10e-4bc8-9671-78e156fcc5df_27548)


