
(ViPi) MTF Candles
Индикатор
106 скачивания
Версия 1.0, Feb 2026
Windows, Mac
Описание
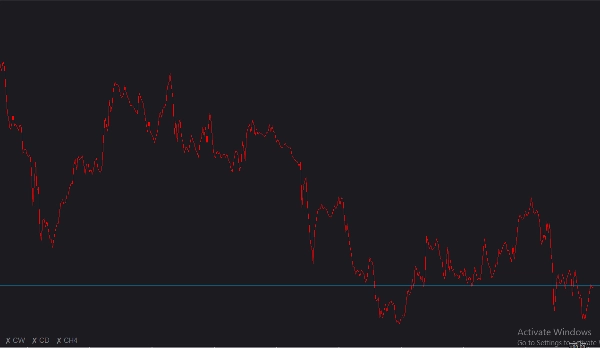
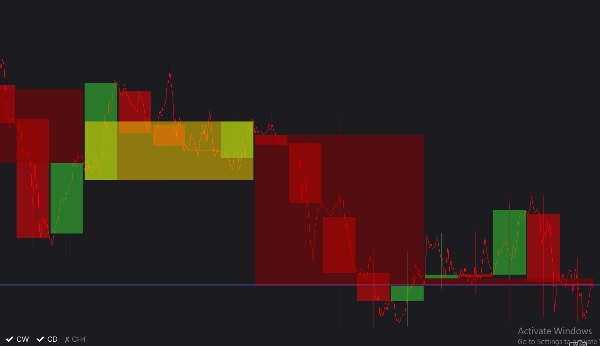
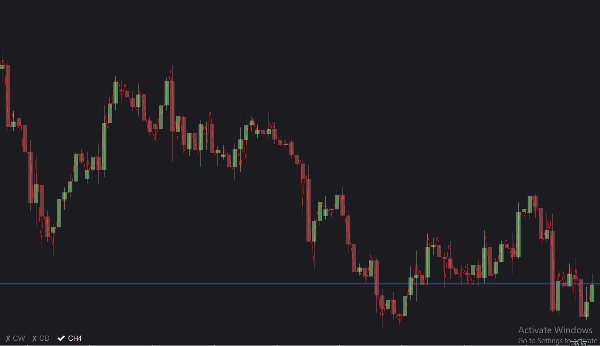
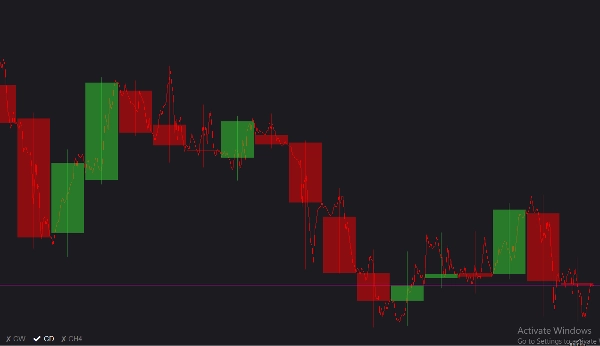
Подробное введение (ViPi) MTF Candles — это высокоинтерактивный, настраиваемый инструмент для построения графиков, предназначенный для предоставления трейдерам обзора рынка сверху вниз, не покидая активный график. Путем бесшовного наложения до трех различных свечей с более высоким таймфреймом (MTF) непосредственно на текущий вид, вы можете легко выявлять макроэкономические тренды, ключевые уровни поддержки/сопротивления и изменения рынка с первого взгляда. В нем есть стильное, ненавязчивое меню переключения на графике, которое позволяет мгновенно скрывать или показывать каждый таймфрейм, обеспечивая чистоту и сосредоточенность рабочего пространства.
Полный список параметров
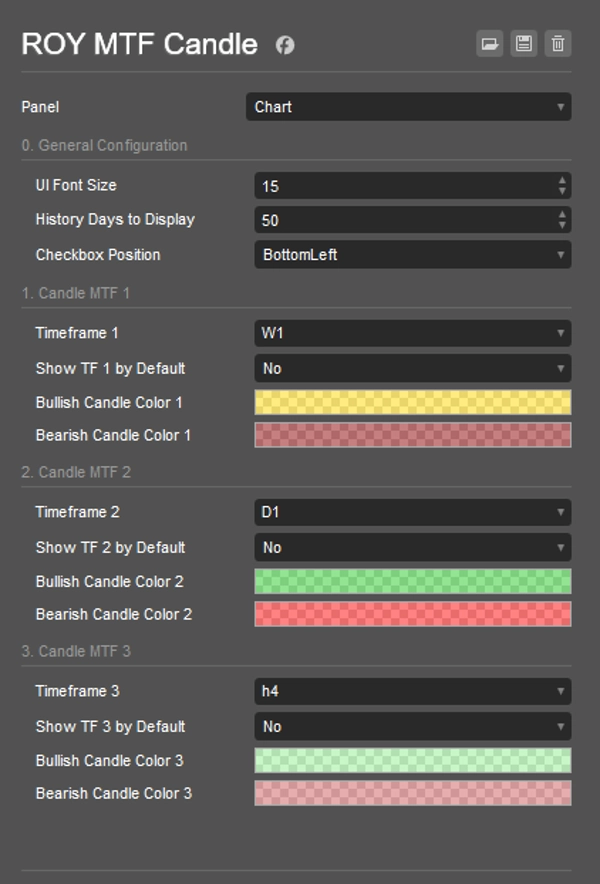
- Размер шрифта интерфейса: Регулирует размер текста для интерактивных кнопок переключения на графике. Может быть установлен в диапазоне от 8 до 30 (по умолчанию: 11).
- Количество дней истории для отображения: Определяет, сколько дней назад индикатор будет отображать исторические свечи MTF (по умолчанию: 50 дней).
- Позиция флажка: Позволяет закрепить меню переключения интерфейса в любом углу вашего графика: Верхний левый, Верхний правый, Нижний левый или Нижний правый (по умолчанию: Нижний левый).
- Таймфреймы 1, 2, 3: Конкретные более высокие таймфреймы, которые вы хотите отслеживать. (По умолчанию: соответственно Weekly, Daily и Hour4).
- Показывать TF 1, 2, 3 по умолчанию: Переключает видимость свечей каждого таймфрейма сразу после применения индикатора к графику (по умолчанию: False).
- Цвета бычьих/медвежьих свечей: Позволяет полностью настроить цвета свечей роста и падения для каждого из трех таймфреймов, включая поддержку прозрачности, чтобы не заслонять основной график.
Руководство по использованию
- Подключение к графику: Загрузите индикатор (ViPi) MTF Candles в ваше активное рабочее пространство cTrader.
- Настройка таймфреймов: Откройте настройки и выберите до трех макро-таймфреймов (например, Weekly, Daily и H4), которые вы хотите отслеживать вместе с текущим таймфреймом.
- Настройка визуальных параметров: Отрегулируйте цвета и прозрачность бычьих и медвежьих свечей для каждого таймфрейма, чтобы они хорошо контрастировали с вашим фоном.
- Переключение видимости на лету: Используйте удобные интерактивные кнопки на графике (расположенные в выбранной вами позиции флажка), чтобы быстро включать и выключать конкретные наложения MTF во время анализа.
Сводка
ИИ-сводка
(ViPi) MTF Candles is a charting indicator for cTrader that overlays up to three higher timeframe (multi-timeframe, MTF) candlestick charts directly onto the current chart. This tool enables traders to analyze broader market trends, key support and resistance levels, and shifts in market sentiment without switching charts. Users can customize the displayed timeframes—commonly Weekly, Daily, and 4-hour—and adjust the number of historical days shown. The indicator includes an on-chart toggle menu, which can be positioned in any corner of the chart, allowing quick visibility control of each timeframe overlay. Visual customization options include adjustable font sizes for toggle buttons and configurable bullish/bearish candle colors with transparency settings to maintain chart clarity. This facilitates a streamlined, interactive top-down market perspective suitable for various markets including Forex, indices, commodities, stocks, and cryptocurrencies.
Профиль индикатора
Отзывы покупателей
0.0
Отзывы: 0
Отзывы покупателей
У этого продукта еще нет отзывов. Уже попробовали его? Поделитесь впечатлениями!
Обсуждение
Частые вопросы
BTCUSD
Forex
Indices
EURUSD
Commodities
GBPUSD
NZDUSD
Crypto
Stocks
XAUUSD
NAS100
USDJPY
Продукты, доступные в cTrader Store, включая торговых ботов, индикаторы и плагины, предоставляются сторонними разработчиками и доступны исключительно в информационных и технических целях. cTrader Store не является брокером и не предоставляет инвестиционные консультации, персональные рекомендации или какие-либо гарантии будущей доходности.
Больше от этого автора


![Логотип продукта "[Stellar Strategies] Smart ADX"](https://cdn.ctrader.com/image/webp/af13b084-b6f6-41db-b7bc-c7e688b57b05_36929)


Цена
С 12/06/2025
1
Продажи
336
Бесплатные установки