
Описание
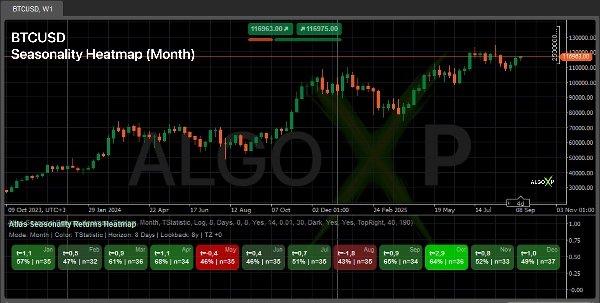
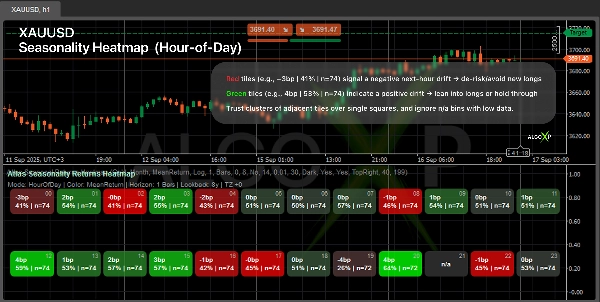
🧭 Таймируйте свои сделки по часам: Atlas показывает, когда рынки обычно движутся по месяцам, дням недели и часам. 🧭
Узнайте, когда ваш рынок обычно движется — по месяцу, дню недели или часу дня.
Atlas вычисляет будущие доходности за выбранный вами период и отображает симметричную тепловую карту (Вниз → Ноль → Вверх). Каждая ячейка показывает метрику (Среднее, T-статистика или Шарп) плюс процент попаданий | n. Используйте её для тайминга входов/выходов, планирования сессий и фильтрации рисков.
🎯 Почему трейдеры используют это
- Выделяйте зелёные окна для входа и красные окна для выхода.
- Планируйте сессии вокруг статистически благоприятных часов/дней.
- Добавьте чистый слой «когда» к дискреционным и системным стратегиям.
⚙️ Как это работает
- Смотрит вперёд на выбранный вами период и суммирует, как цена обычно ведёт себя в этом периоде.
- Группирует результаты по временным интервалам (Месяц / День недели / Час) и учитывает ваш часовой пояс.
- Применяет защиту от выбросов и надёжный показатель силы для каждого интервала (плюс размер выборки).
- Отображает сбалансированную тепловую карту вокруг нейтрали, используя ваши цвета Вверх / Ноль / Вниз.
👥 Для кого это
- Дискреционные трейдеры — лучшее таймирование и размер позиций по сессиям.
- Создатели систем и ботов — фильтр времени / размер позиции по времени для стратегий.
- Трейдеры криптовалют и индексов — быстрые поведенческие паттерны по дням/часам.
- Новички — простой вывод: зеленее = более позитивный уклон за выбранный вами период.
🚀 Быстрый старт
- Выберите предустановку актива (Forex/Crypto/Index/Gold).
- Установите горизонт (например, 1 час для HOD, 1 день для DOW/Month).
- Настройте период анализа, минимальное количество наблюдений и цвета.
- Читайте кластеры (несколько соседних зелёных/красных ячеек) для самых сильных сигналов.
ℹ️ Сезонность не гарантирует будущих результатов. Это статистический паттерн, зависящий от периода и методологии. Используйте индикатор как контекст для ваших правил входа/выхода и управления рисками, тестируйте надёжность на разных периодах анализа и избегайте опоры на интервалы с маленьким n (размером выборки).
Сводка
The indicator supports multiple asset presets including Forex, Crypto, Indices, and Commodities, and respects the user’s timezone. It applies outlier protection and calculates a robust strength score per time bucket to ensure reliable insights. Users can customize parameters like lookback period, minimum observations, and color schemes.
Atlas is suitable for discretionary traders seeking better timing and sizing, system and bot builders needing a time-based filter or sizing layer, crypto and index traders analyzing behavioral patterns, and beginners looking for a straightforward indication of positive or negative market bias. It provides a statistical context for entry/exit decisions and risk management but should be used alongside other analysis tools.
Отзывы покупателей
5 | 50 % | |
4 | 50 % | |
3 | 0 % | |
2 | 0 % | |
1 | 0 % |


![Логотип продукта "[Hamster-Coder] Bollinger Bands"](https://cdn.ctrader.com/image/webp/21d8e5d6-fb11-4bac-b9ee-cd05c2b76804_30327)


![Логотип продукта "[Hamster-Coder] Moving Average MTF"](https://cdn.ctrader.com/image/webp/b11b98b1-194d-4b8e-b00e-d611826ad159_31226)


