
Описание
Вот формула для расчёта стандартных опорных точек (Pivot Points):
PP = (High + Low + Close)/3
S1 = (PP * 2) – High
S2 = PP – (High – Low)
S3 = Low – 2(High – PP)
R1 = (PP * 2) – Low
R2 = PP + (High – Low)
R3 = High + 2(PP – Low)
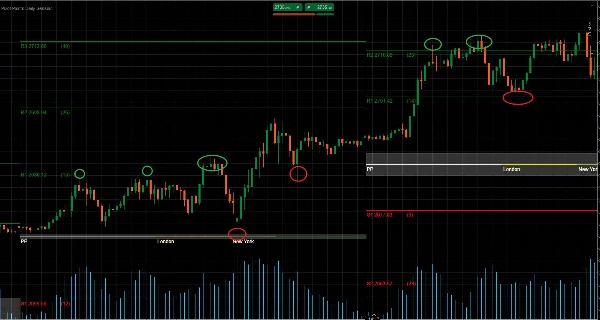
Опорные точки можно использовать для определения общего тренда, поскольку движение через опорные точки вверх указывает на восходящий тренд. В то же время противоположная ситуация, когда цена продолжает падать ниже опорных точек в течение сессии, свидетельствует о нисходящем тренде.
На рынке с боковым движением трейдеры могут просто продавать (занимать короткие позиции) на уровне сопротивления и покупать (занимать длинные позиции) на уровне поддержки. Например, если рынок находится между R1 и S1, ордера на покупку будут размещены около S1, а ордера на продажу — около R1.
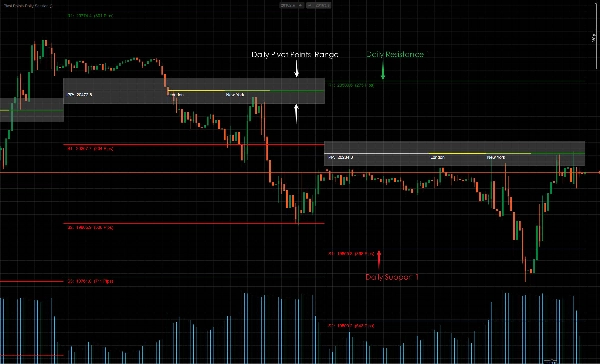
На трендовом рынке соответствующие опорные точки будут служить ориентирами для откатов, после которых рынок возобновит основной тренд. Например, если цены находятся выше PP во время восходящего тренда, но ниже R2, трейдеры могут рассмотреть возможность размещения выгодных ордеров на покупку около R1.
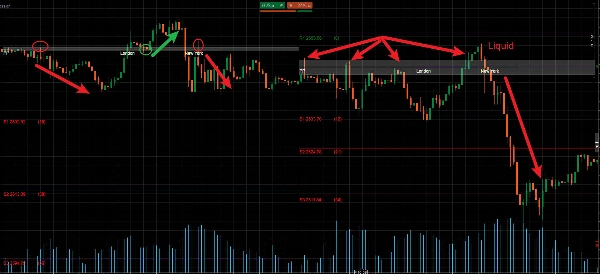
Уровни поддержки и сопротивления в некоторых случаях рынка обязательно будут пробиты. Эти периоды пробоев могут предоставить множество торговых возможностей. Опорные точки также можно использовать для торговли потенциальными ценовыми пробоями на рынке.
Ценовые пробои происходят, когда цена прорывается через существующий уровень поддержки или сопротивления и фактически меняет его роль. Например, если происходит нисходящий пробой на уровне S2, линия опорной точки перестанет быть линией поддержки и теперь будет считаться линией сопротивления.
В этом случае ниже S2 будут рассматриваться только ордера на продажу, а другие линии опорных точек могут служить ориентиром для установки стоп-лоссов и тейк-профитов. Стоп-лоссы для ордеров на продажу можно размещать выше S2 и S1, а цели по прибыли — на уровне S3 и ниже.
中文说明:
枢轴点可用于识别整体趋势,因为价格向上突破枢轴点表明上升趋势。与此同时,相反的情况,即价格在交易时段内持续跌破枢轴点,则表明下降趋势。
在区间震荡市场中,交易者可以简单地在阻力位做空(卖出)和在支撑位做多(买入)。例如,如果市场在R1和S1之间波动,买单将放置在S1附近,卖单放置在R1附近。
在趋势市场中,相关的枢轴点将作为回调市场恢复主要趋势的参考点。例如,如果在上升趋势中价格高于PP但低于R2,交易者可以考虑在R1附近设置有利可图的买单。
支撑位和阻力位在某些市场情况下必然会被突破。这些突破期可以在市场中提供许多交易机会。枢轴点也可用于交易市场中潜在的价格突破。
价格突破发生在价格冲破现有的支撑位或阻力位并有效转换其角色时。例如,如果在S2处发生向下突破,该枢轴线将不再是支撑线,而将被视为阻力线。
在这种情况下,只有在S2下方才会考虑卖单,其他枢轴线可以指导止损和止盈的设置。卖单的止损可以设在S2和S1上方,盈利目标设在S3及以下。
Сводка
Отзывы покупателей
5 | 100 % | |
4 | 0 % | |
3 | 0 % | |
2 | 0 % | |
1 | 0 % |


