Описание
Объемно-взвешенное преимущество: полный план для импульса cTrader
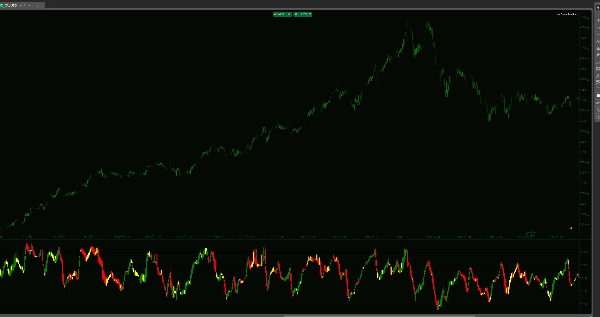
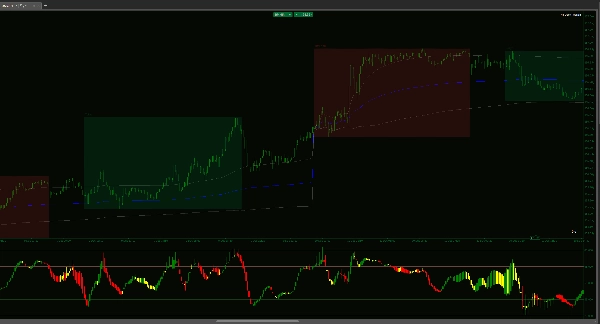
Стандартные индикаторы показывают, где была цена. Индикатор Volume-Weighted RSI Candles показывает убежденность за движением. Объединяя ценовое действие, объем тиков и пять критических институциональных уровней, этот инструмент превращает RSI из простого осциллятора в комплексную систему картирования тренда.
Вместо одной линии вы получаете полноценные свечи OHLC в окне индикатора. Это позволяет видеть «структуру» импульса — показывая, поддерживается ли движение крупным институциональным объемом или это просто «фейк-аут» при низкой ликвидности.
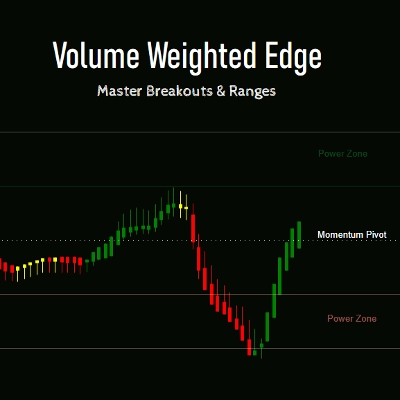
Стратегия исполнения в 5 зонах
- Расширения силы (65–80 & 20–35): Это зоны с высокой уверенностью. Когда объемно-взвешенные свечи удерживаются здесь, вы не ищете развороты — вы следуете тренду. Здесь оперируют крупные деньги и происходят самые взрывные движения.
- Коридоры скальпинга (50–65 & 35–50): Идеально для азиатской сессии или рынков с ограниченным диапазоном. Когда тренд на старшем таймфрейме нейтрален, эти зоны предоставляют высоковероятные цели «возврата к среднему». Если рынок находится в боковике, эти коридоры позволяют скальпировать вращения с хирургической точностью.
- Поворотный момент импульса (50): Крайняя черта. Закрытие тела объемно-взвешенной свечи выше или ниже этого уровня — ваше первое предупреждение о структурном сдвиге в контроле рынка.
Почему этот инструмент меняет ваш рабочий процесс
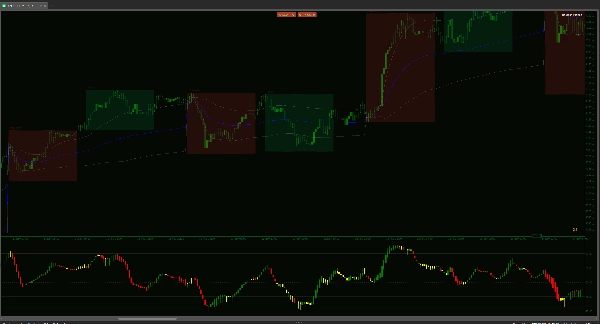
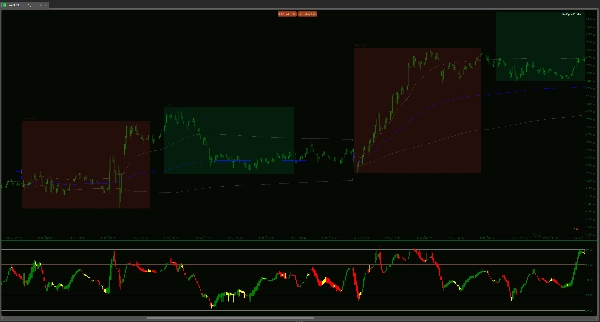
Объемно-взвешенная ясность: Каждая свеча рассчитывается путем умножения изменения цены на объем тиков. Если движение происходит при низком объеме, свеча RSI не подтвердит его. Это убережет вас от «ловушек» — движений, которые выглядят хорошо на графике цены, но не имеют поддержки.
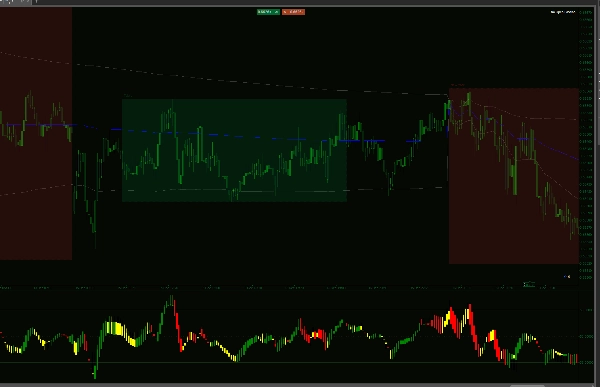
Информация о теле свечи: Традиционные линии RSI нервные и зубчатые. Наши свечи, сглаженные WMA, показывают вам «открытие» и «закрытие» импульса. Если тело свечи RSI толстое и плотное, тренд здоровый. Если фитили длинные, импульс иссяк.
Многофункциональность для разных рынков: * Трендовый: используйте диапазон 65–80, чтобы дольше оставаться в прибыльных сделках.
Боковой/скальпинг: используйте коридоры 35–65, чтобы ловить быстрые вращения во время сессий с низкой волатильностью, таких как Азия.
Избегайте ловушки «штрихкода»: Большинство индикаторов заставляют вас гадать в периоды низкой волатильности. Этот индикатор имеет уникальный визуальный эффект «штрихкода» во время консолидации. Когда свечи сужаются, выравниваются и становятся нейтральными, индикатор сообщает, что «рыночный двигатель» выключен. Это визуальное предупреждение спасает вас от входа в ложные движения с низким объемом и от «измельчения», когда за движением цены нет реальных денег.
Оптимизация для cTrader: Создан специально для C# API с логикой «Максимальное количество визуальных свечей», чтобы ваша платформа оставалась отзывчивой, даже на минутных графиках.
Перестаньте торговать, основываясь на том, куда может пойти рынок. Начните торговать, основываясь на том, куда объем действительно его толкает. Этот индикатор — не просто о сигналах, а о понимании внутренней энергии рынка.
Сводка
Отзывы покупателей
5 | 33 % | |
4 | 67 % | |
3 | 0 % | |
2 | 0 % | |
1 | 0 % |


