
MTF Candle Window - On Chart
Индикатор
7 покупки
Версия 1.0, Feb 2025
Windows, Mac
4.3
Отзывы: 3
Описание
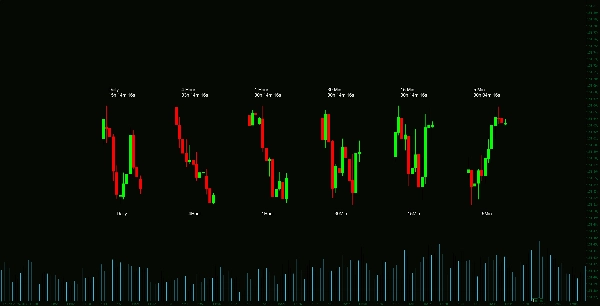
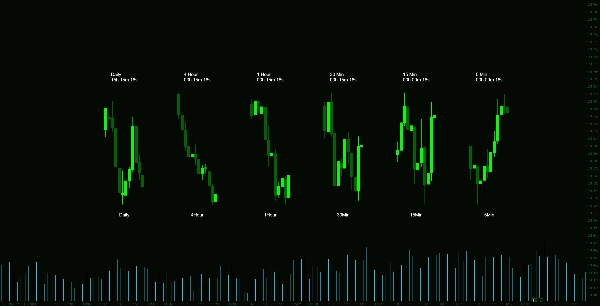
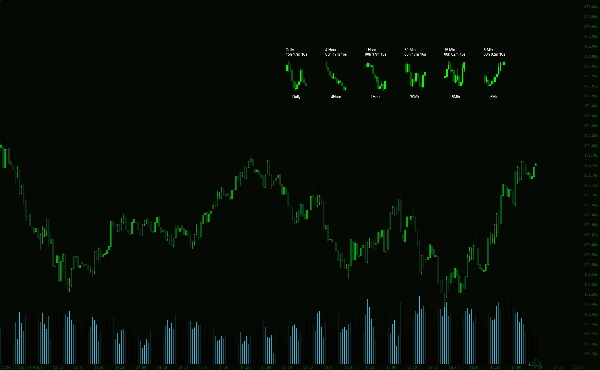
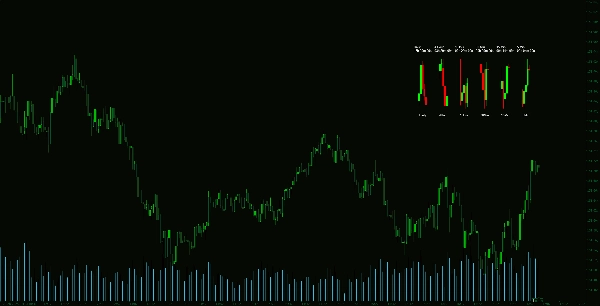
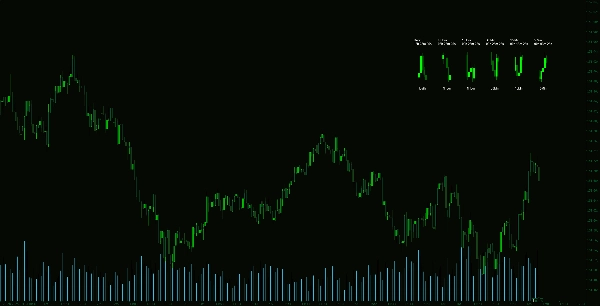
Индикатор Multi-Timeframe Candle — это высоконастраиваемый инструмент, который предоставляет четкий и компактный обзор ценового движения на основных таймфреймах. Он отображает свечи с нескольких таймфреймов в отдельном окне, позволяя трейдерам быстро оценивать структуру рынка без переключения графиков.
Основные функции:
Сводка
ИИ-сводка
The Multi-Timeframe Candle Indicator is a customizable trading tool that displays price candles from multiple major timeframes within a single dedicated window on the chart. This allows traders to efficiently monitor market structure and price action across different timeframes without switching between charts. Key features include adjustable candle height, horizontal and vertical offsets, and the number of candles shown per timeframe. It also offers a dynamic countdown timer indicating the time remaining until each candle closes, positioned at the top or bottom of the candles. Users can fully customize the appearance by modifying colors, text offsets, and font sizes to suit their trading preferences. This indicator supports streamlined market analysis by helping traders quickly identify trends, reversals, and momentum shifts, enhancing decision-making and trade execution.
Профиль индикатора
Отзывы покупателей
4.3
Отзывы: 3
5 | 33 % | |
4 | 67 % | |
3 | 0 % | |
2 | 0 % | |
1 | 0 % |
Отзывы покупателей
February 20, 2025
Entry aware signal check for chart reading. it makes market context easier to scan, especially when used for adding confirmation before a trade. I would test it on 2 timeframes, 20 signals and a 1R stop plan. It is stronger when a 1.5R target is realistic before the entry.
February 19, 2025
February 19, 2025
Setup first trade assistant for a more controlled workflow. It helps with adding confirmation before a trade, but it should not be used as a blind entry trigger. I would test it on 2 timeframes, 20 signals and a 1R stop plan. I would still keep manual review in the process.
Обсуждение
Частые вопросы
Продукты, доступные в cTrader Store, включая торговых ботов, индикаторы и плагины, предоставляются сторонними разработчиками и доступны исключительно в информационных и технических целях. cTrader Store не является брокером и не предоставляет инвестиционные консультации, персональные рекомендации или какие-либо гарантии будущей доходности.


Цена
С 14/01/2025
55
Продажи
11.36K
Бесплатные установки