
Описание
Откройте для себя более глубокое понимание динамики рынка Форекс с помощью комплексного индикатора Relative Currency Strength (RCS), специально разработанного для платформы cTrader.
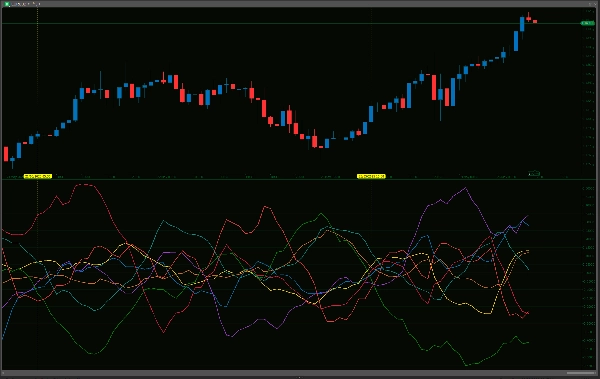
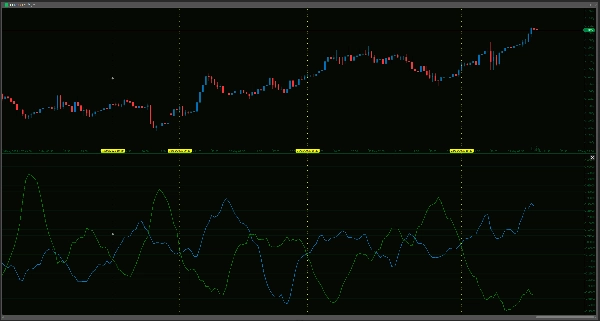
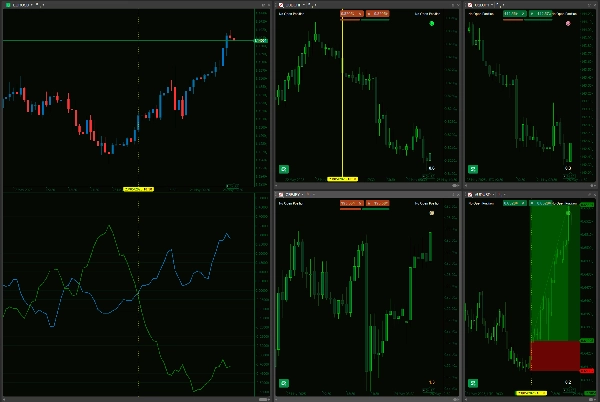
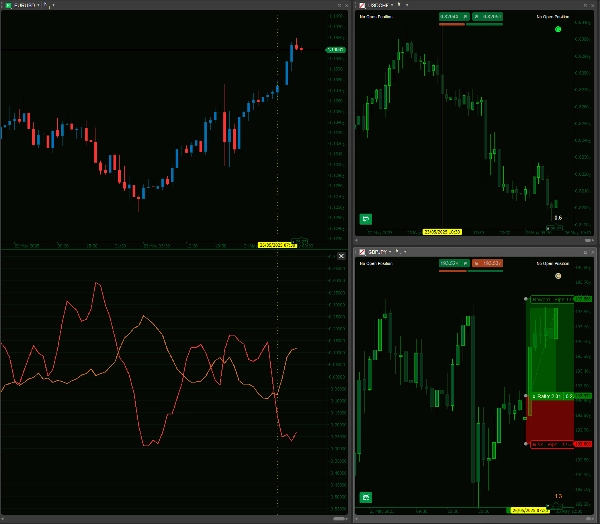
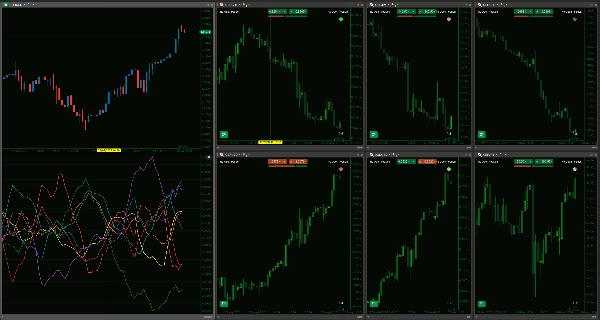
Этот мощный инструмент тщательно оценивает индивидуальную производительность восьми основных валют — AUD, USD, EUR, JPY, GBP, CAD, CHF и NZD — анализируя их процентное изменение относительно друг друга в корзине из 28 валютных пар. С помощью настраиваемых пользователем периодов обратного просмотра и сглаживания вы можете точно настроить чувствительность индикатора в соответствии с вашим уникальным торговым подходом, от быстрого скальпинга до стратегий с долгосрочным горизонтом. Четкий визуальный вывод позволяет мгновенно сравнивать данные, помогая быстро выявлять валюты с сильным восходящим импульсом или те, которые показывают признаки слабости, что может быть полезно при выборе валютных пар с большим потенциалом для ваших стратегий. Это предлагает способ выйти за рамки анализа одной пары и увидеть общую картину того, какие отдельные валюты действительно движут рыночные движения.
Однако крайне важно использовать этот индикатор с четким пониманием его возможностей и ограничений. Индикатор RCS — это сложный аналитический инструмент, а не безошибочное средство прогнозирования или полноценная торговая система «установил и забыл». Его расчеты основаны на исторических данных о ценах и предназначены для дополнения, а не замены вашей установленной торговой методологии, которая всегда должна включать тщательный анализ ценового действия, учет фундаментальных факторов и надежные методы управления рисками. Хотя линии выделяют «силу» или «слабость», эти показания требуют внимательной интерпретации в более широком рыночном контексте; например, валюта, демонстрирующая экстремальную «силу», может приближаться к состоянию перекупленности или ключевому уровню сопротивления.
Работа индикатора также может меняться в зависимости от текущих рыночных условий (например, он может вести себя по-разному на сильно трендовых и боковых, флуктуационных рынках), а его точность зависит от наличия у вашей платформы достаточного объема чистых исторических данных по всем 28 валютным парам. Хотя индикатор оптимизирован для непрерывных расчетов, начальная загрузка данных для такого комплексного анализа кросс-валют может быть ресурсоемкой для платформы, особенно при медленном соединении или менее мощном оборудовании. Предоставляя тонкий многовалютный взгляд, этот индикатор RCS предлагается как ценный помощник для принятия более информированных, стратегически обоснованных торговых решений и потенциального повышения вашего преимущества на конкурентном рынке Форекс, а не как самостоятельное решение.
Пожалуйста, убедитесь, что ваш брокер предлагает все кросс-пары, используемые в этом индикаторе, чтобы он мог работать корректно.
--------------------------
Пожалуйста, ознакомьтесь с моими другими индикаторами!
https://ctrader.com/products/1181
https://ctrader.com/products/1182
https://ctrader.com/products/1180
https://ctrader.com/products/1015
https://ctrader.com/products/555
https://ctrader.com/products/553
https://ctrader.com/products/554
https://ctrader.com/products/552
https://ctrader.com/products/557
https://ctrader.com/products/845
https://ctrader.com/products/848
https://ctrader.com/products/847
https://ctrader.com/products/846
https://ctrader.com/products/551
https://ctrader.com/products/574
https://ctrader.com/products/573
https://ctrader.com/products/556
https://ctrader.com/products/558
https://ctrader.com/products/559
https://ctrader.com/products/560
Сводка
The indicator provides a clear visual representation of currency strength and weakness, enabling traders to identify currencies with strong momentum or signs of weakness at a glance. This multi-currency perspective helps move beyond single-pair analysis to understand which currencies are driving market movements.
The tool relies on historical price data and requires all relevant currency pairs to be available from the broker. Its performance may vary with market conditions, and it is intended to complement, not replace, comprehensive trading strategies that include price action, fundamental analysis, and risk management. Initial data loading can be resource-intensive due to the breadth of cross-currency calculations.
This indicator serves as an analytical aid to support more informed Forex trading decisions by highlighting relative currency strength across major pairs.
Отзывы покупателей
5 | 33 % | |
4 | 67 % | |
3 | 0 % | |
2 | 0 % | |
1 | 0 % |


