
VIX - volatility indicator
Индикатор
2 покупки
Версия 1.2, Apr 2026
Windows, Mac
4.5
Отзывы: 2
Описание
Этот проприетарный индикатор VIX, основанный на Average True Range (ATR), обеспечивает точный и чистый анализ волатильности рынка, оптимизированный для cTrader 5.5.13+. Он сочетает масштабированное движение VIX с анализом объема для подтверждения крупных сдвигов и потенциальных прорывов.
Ключевые особенности и качество кода
- Отсутствие ошибок/предупреждений: Полностью переработан под последнюю версию API cTrader, устраняя все устаревшие ошибки и предупреждения для максимальной стабильности и производительности.
- VIX на основе ATR: Обеспечивает отзывчивую меру волатильности, нормализованную для выявления экстремальных рыночных условий.
- Двойное подтверждение: Использует волатильность (линия VIX) в сочетании с данными о тиковом объеме для проверки сигналов прорыва с высокой вероятностью.
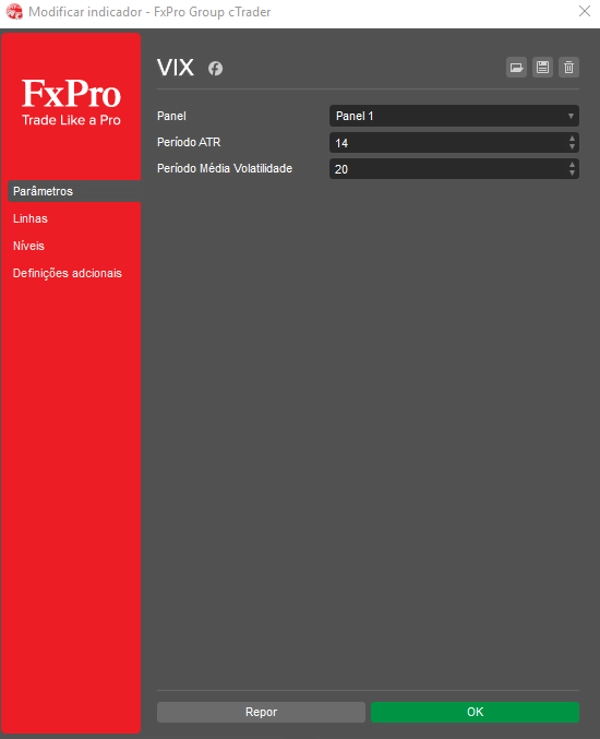
Настройте индикатор для максимальной информативности
Легко тонко настраивайте индикатор в соответствии с вашей торговой стратегией, устанавливая желаемые значения для Низкого уровня VIX и Высокого уровня VIX. Кроме того, отрегулируйте Коэффициент масштабирования VIX для точного контроля высоты и визуализации линии VIX в нижней панели.
Как читать сигналы прорыва и консолидации
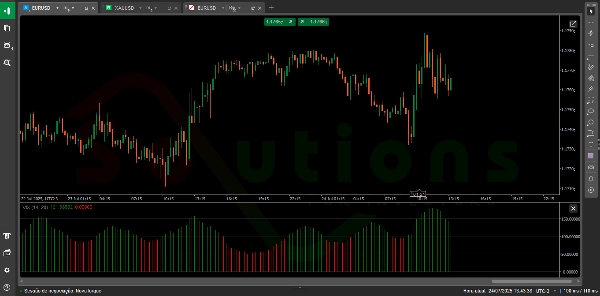
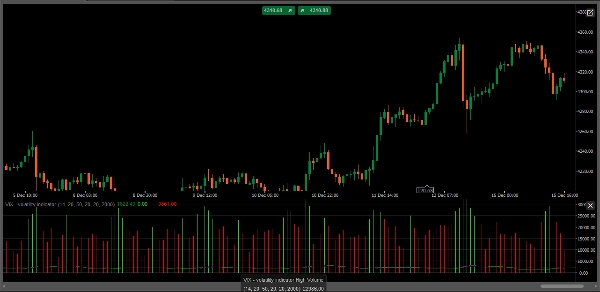
- Сигнал прорыва (высокая волатильность): Когда линия VIX резко пробивает вверх Высокий уровень VIX И сопровождается высоким объемом (обозначенным гистограммой Высокого объема), это подтверждает экстремальный страх/жадность и сигнализирует о высоковероятном прорыве рынка.
- Сигнал консолидации (низкая волатильность): Когда линия VIX опускается ниже Низкого уровня VIX, это часто указывает на период рыночного спокойствия, плотной консолидации или потенциального возврата к среднему — идеально для подготовки следующего шага или снижения риска.
- Информация об объеме: Индикатор отображает гистограммы Высокого объема (зеленого) и Низкого объема (красного) на заднем плане, позволяя мгновенно оценить ликвидность и уверенность за текущим движением цены.
Сводка
ИИ-сводка
The VIX - Volatility Indicator is a proprietary tool designed for the cTrader platform (version 5.5.13 and above) that measures market volatility using an Average True Range (ATR)-based approach. It combines a scaled VIX line with tick volume data to provide dual confirmation of market conditions, helping traders identify potential breakouts and consolidation phases.
Key features include:
- ATR-based VIX calculation for responsive volatility measurement normalized to detect extreme market conditions.
- Volume analysis with high (green) and low (red) volume histograms to assess liquidity and conviction behind price movements.
- Customizable parameters allowing users to set Low VIX Level and High VIX Level thresholds, as well as adjust the VIX Scale Factor for optimal visualization.
Usage signals:
- A breakout alert occurs when the VIX line surpasses the High VIX Level accompanied by high volume, indicating potential market breakouts driven by extreme fear or greed.
- A consolidation signal is identified when the VIX falls below the Low VIX Level, suggesting periods of low volatility, market calm, or potential mean reversion.
This indicator supports analysis across various markets including Forex, indices, commodities, stocks, and cryptocurrencies.
Профиль индикатора
Отзывы покупателей
4.5
Отзывы: 2
5 | 50 % | |
4 | 50 % | |
3 | 0 % | |
2 | 0 % | |
1 | 0 % |
Отзывы покупателей
March 6, 2025
ngl, breaks are easier to judge and that is enough to keep testing it. It is not the whole trading plan.
February 28, 2025
reads better when the chart already supports the idea. Spread and slippage need a line in the notes.
Обсуждение
Частые вопросы
BTCUSD
Forex
Signal
Breakout
Indices
EURUSD
Commodities
GBPUSD
NZDUSD
Prop
Crypto
Stocks
XAUUSD
NAS100
USDJPY
Продукты, доступные в cTrader Store, включая торговых ботов, индикаторы и плагины, предоставляются сторонними разработчиками и доступны исключительно в информационных и технических целях. cTrader Store не является брокером и не предоставляет инвестиционные консультации, персональные рекомендации или какие-либо гарантии будущей доходности.


Цена
С 05/02/2025
31
Продажи