
Описание
Пользовательский RSI – точные развороты с чистой визуализацией
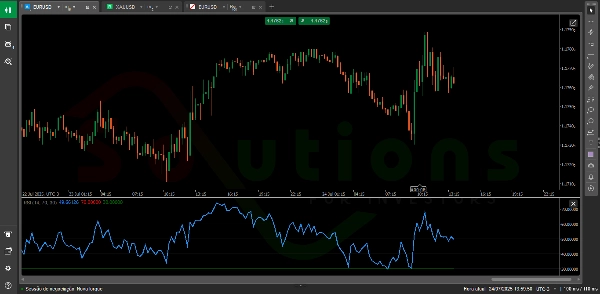
Пользовательский RSI — это усовершенствованная версия классического Индекса относительной силы (RSI), разработанная, чтобы помочь трейдерам быстро выявлять зоны перекупленности и перепроданности — ключевые области, где цена, вероятно, развернется.
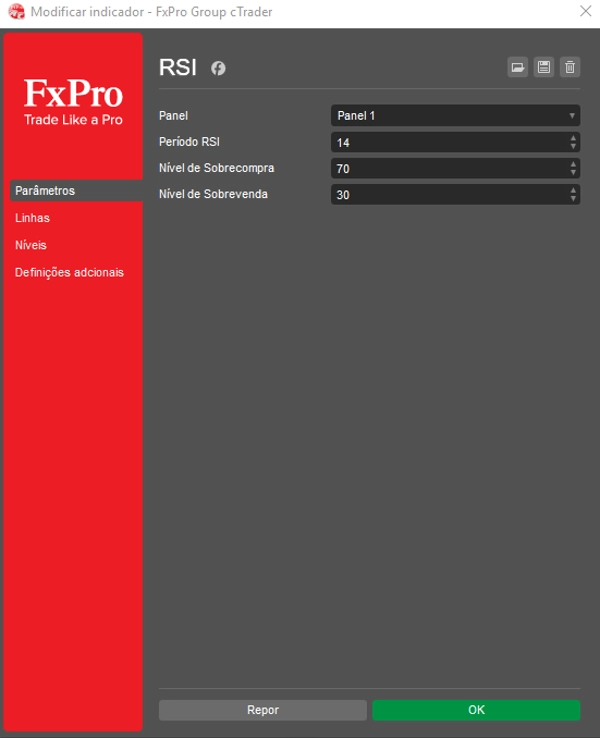
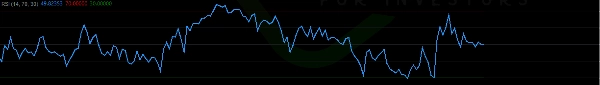
С чистым и интуитивно понятным интерфейсом он отображает две полностью настраиваемые горизонтальные линии (как традиционные уровни 70 и 30), четко отмечая точки принятия решений с высокой вероятностью на графике.
✅ Настраивайте таймфрейм и уровни RSI под ваш стиль торговли
✅ Определяйте потенциальные зоны разворота с большей уверенностью
✅ Улучшайте технический анализ с помощью четкого, не загроможденного индикатора
Идеально подходит для трейдеров всех уровней, Пользовательский RSI преобразует необработанные данные о цене в умные, практические инсайты — делая его незаменимым инструментом для прибыльного принятия решений.
Сводка
Отзывы покупателей
5 | 0 % | |
4 | 100 % | |
3 | 0 % | |
2 | 0 % | |
1 | 0 % |


