
Описание
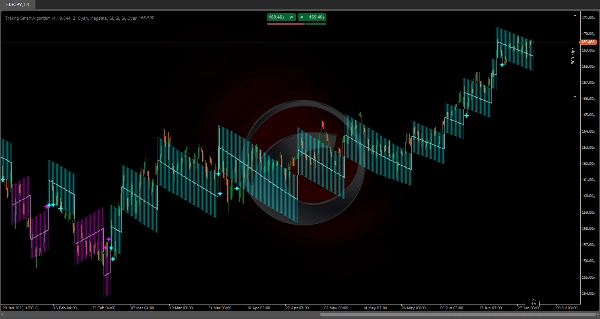
Трейлинг Умный Алгоритм
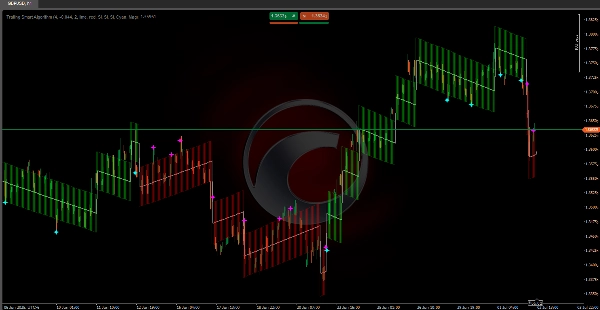
https://chartshots.spotware.com/c/69f0f1d89000b
Включает математические алгоритмы 🧠 специально разработанные для постоянного отслеживания цены в любых рыночных условиях 🌐.
Его структура вычислений обеспечивает постоянную синхронизацию трендовой линии с движениями цены, избегая типичной задержки традиционных индикаторов ⏳.
В отличие от обычных алгоритмов, эта система использует точные измерения волатильности 📊 и применяет автоматические настройки ⚙️, гарантирующие оптимальное отслеживание. Его внутренние вычисления созданы для обеспечения точного отображения направления рынка, поддерживая точность как при быстрых движениях ⚡, так и при постепенном развитии тренда 🕊️.
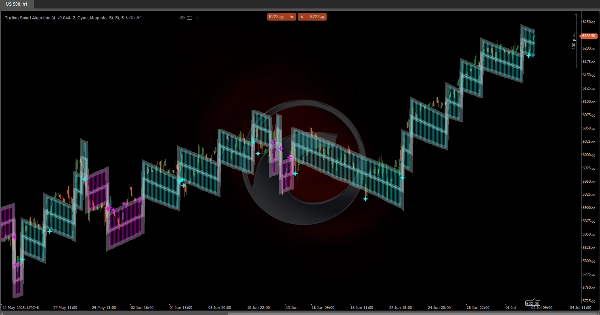
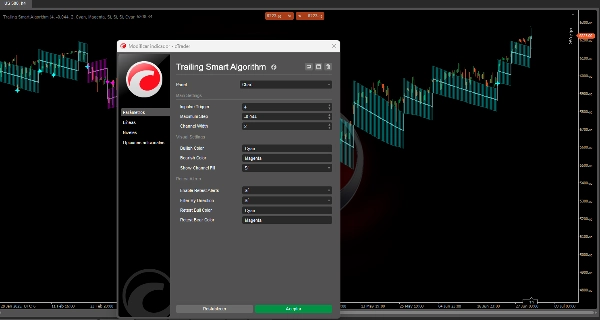
https://chartshots.spotware.com/c/69f0f218591b0
💡 Как это работает?
Индикатор работает с использованием адаптивной системы шагов, которая движется в направлении доминирующего тренда.
Он основан на трёх основных компонентах:
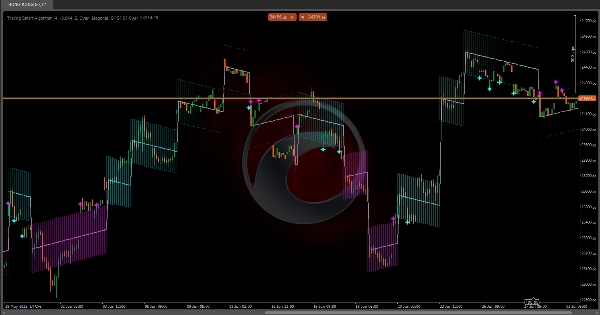
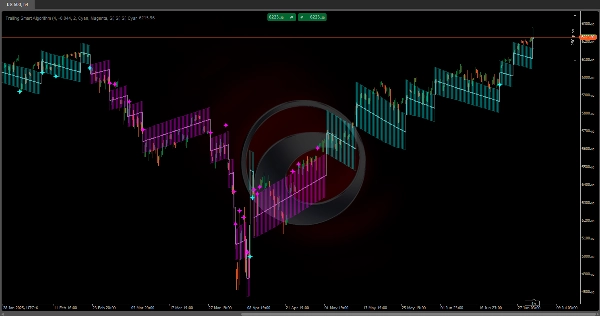
https://chartshots.spotware.com/c/69f0f2b19e4d3
1️⃣ Обнаружение изменения тренда
Система непрерывно отслеживает цену для выявления значительных движений, превышающих определённый порог (Импульсный Триггер 🎯).
Когда цена отходит достаточно далеко от текущей трендовой линии, индикатор распознаёт потенциальное изменение направления и переставляет свою основную линию.
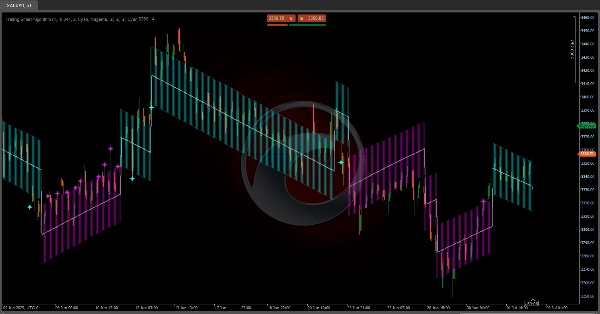
2️⃣ Динамический трейлинг
После установки направления трендовая линия движется шаг за шагом 🪜 в том же направлении, что и рынок.
Каждый шаг рассчитывается на основе текущей волатильности (ATR 📈):
• В более волатильных рынках шаги больше 🌊
• В более спокойных рынках шаги меньше 🌿
3️⃣ Канал волатильности
Вокруг основной линии формируется канал (верхняя и нижняя полосы), представляющий зону нормальной волатильности 📉📈.
Этот канал помогает определить, ведёт ли себя цена в пределах нормальных параметров или совершает экстремальные движения 🚨.
📏 Канал волатильности
• Верхняя полоса: Верхний предел канала волатильности
• Нижняя полоса: Нижний предел канала волатильности
✨ Сигналы ретеста
• Голубые звёзды 🌟: Цена касается или пересекает нижнюю полосу во время восходящего тренда
• Малиново-розовые звёзды ⭐: Цена касается или пересекает верхнюю полосу во время нисходящего тренда
⚙️ Настройки параметров
🔹 Основные параметры
Импульсный Триггер (значение по умолчанию: 4)
Что он делает?
Определяет чувствительность для обнаружения изменений тренда. Это множитель ATR, определяющий, насколько должна измениться цена, чтобы вызвать смену направления.
Влияние при изменении:
• Более высокие значения (5–8):
- Более устойчив к изменениям тренда 🛡️
- Меньше ложных сигналов
- Медленнее реагирует на реальные изменения
• Более низкие значения (2–3):
- Более высокая чувствительность 🎯
- Более быстрая реакция
- Более вероятно появление ложных сигналов на боковых рынках
Максимальный шаг (значение по умолчанию: -0.044)
Что он делает?
Ограничивает максимальный размер каждого шага, который может сделать трендовая линия. Это отрицательное значение, действующее как предел.
Влияние при изменении:
• Менее отрицательное (-0.020 до -0.030):
- Более крупные шаги 🚀
- Более агрессивное отслеживание тренда
• Более отрицательное (-0.050 до -0.080):
- Меньшие, более постепенные шаги 🌱
- Более консервативное следование
Ширина канала (значение по умолчанию: 2)
Что он делает?
Определяет ширину канала волатильности вокруг основной линии.
Влияние при изменении:
• Более высокие значения (3–4):
- Шире канал 🟢
- Меньше сигналов ретеста
- Большая толерантность к волатильности
• Более низкие значения (1–1.5):
- Узкий канал 🔴
- Больше сигналов ретеста
- Более чувствителен к шуму
🎨 Визуальные параметры
Цвет бычьего тренда / Цвет медвежьего тренда
Определяют цвета для восходящих и нисходящих трендов соответственно.
Показывать заливку канала
Включить или отключить визуальную заливку канала волатильности 🌈.
🔔 Настройки ретеста
Включить оповещения ретеста
Переключение сигналов ретеста при касании ценой полос канала.
Фильтр по направлению
При включении отображаются только сигналы ретеста, соответствующие текущему тренду:
• В восходящем тренде: Только сигналы на нижней полосе
• В нисходящем тренде: Только сигналы на верхней полосе
🌟 Итог сигналов ретеста
• Голубая звезда на нижней полосе: Потенциальный бычий отскок от динамической поддержки ✅
• Малиново-розовая звезда на верхней полосе: Потенциальный медвежий отскок от динамического сопротивления ❌
Сводка
Отзывы покупателей
5 | 100 % | |
4 | 0 % | |
3 | 0 % | |
2 | 0 % | |
1 | 0 % |


![Логотип продукта "[CB] Pivot Points Pro"](https://cdn.ctrader.com/image/webp/43463c82-67b0-4f10-a4ba-901bba091d81_32594)


![Логотип продукта "[Stellar Strategies] Market Session Ultimate"](https://cdn.ctrader.com/image/webp/61ffd537-0125-4246-9e72-42eca1791d64_28232)


![Логотип продукта "[Stellar Strategies] MARSI Signal Plotter"](https://cdn.ctrader.com/image/webp/7b2b8da6-8f8e-4646-8d4a-4710c516c01e_25567)
