
Описание
Классический пропорциональный CVD (с якорем)
Раскройте истинные намерения участников рынка с помощью Классического пропорционального CVD. В отличие от стандартных индикаторов кумулятивного дельта-объема, которые просто суммируют объем тиков, этот инструмент использует пропорциональную логику для взвешивания объема на основе фактического ценового действия в каждом баре.
Почему «Пропорциональная» дельта?
Стандартный CVD может вводить в заблуждение. Этот индикатор вычисляет дельту, анализируя соотношение между диапазоном бара (High-Low) и расстоянием Close-Open. Это обеспечивает реалистичное распределение объема:
- Свечи с сильной уверенностью (закрытие близко к максимуму/минимуму) вносят больший вклад в дельту.
- Свечи с длинными тенями (признаки поглощения или отторжения) нейтрализуют дельту, предотвращая «фальшивые» сигналы объема.
Ключевые особенности
- ⚓ Умное якорение (сброс по нескольким таймфреймам): Держите ваш анализ актуальным для текущей торговой сессии. Выбирайте сброс расчета ежедневно, еженедельно или ежемесячно — или оставляйте его работающим бесконечно.
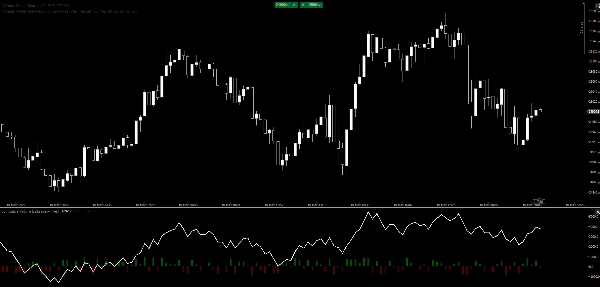
- 📊 Двойная визуализация:
-
- Линия CVD: Чистая, высокопроизводительная линия для выявления долгосрочных дивергенций и истощения тренда.
- Наложение гистограммы: Мгновенная визуальная обратная связь по давлению покупок/продаж на каждом баре для быстрого определения кульминации или поглощения.
- ⚡ Сверхлегкий: Написан с использованием нативной оптимизации C# для cTrader, обеспечивая отсутствие задержек даже на слабых машинах или в волатильных рынках.
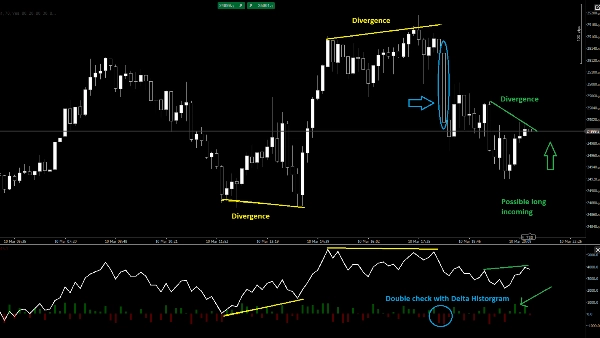
- 🎯 Обнаружение дивергенций: Легко выявляйте, когда цена достигает новых максимумов, а CVD не подтверждает — классический признак институционального распределения.
Как торговать с ним
- Подтверждение тренда: Следите, чтобы линия CVD двигалась в том же направлении, что и цена.
- Поглощение: Когда цена достигает нового минимума, но гистограмма CVD показывает сильный «Delta Up» (зеленый), покупатели поглощают давление продаж.
- Истощение: Следите за резким всплеском на гистограмме (кульминация), за которым следует разворот линии CVD.
Параметры:
- Режим якорения: Никогда, ежедневно, еженедельно, ежемесячно.
- Показать дельту бара: Включить/выключить гистограмму.
Раскройте истинные намерения участников рынка с помощью Классического пропорционального CVD. В отличие от стандартных индикаторов кумулятивного дельта-объема, которые просто суммируют объем тиков, этот инструмент использует пропорциональную логику для взвешивания объема на основе фактического ценового действия в каждом баре.
Почему «Пропорциональная» дельта?
Стандартный CVD может вводить в заблуждение. Этот индикатор вычисляет дельту, анализируя соотношение между диапазоном бара (High-Low) и расстоянием Close-Open. Это обеспечивает реалистичное распределение объема:
- Свечи с сильной уверенностью (закрытие близко к максимуму/минимуму) вносят больший вклад в дельту.
- Свечи с длинными тенями (признаки поглощения или отторжения) нейтрализуют дельту, предотвращая «фальшивые» сигналы объема.
Ключевые особенности
- ⚓ Умное якорение (сброс по нескольким таймфреймам): Держите ваш анализ актуальным для текущей торговой сессии. Выбирайте сброс расчета ежедневно, еженедельно или ежемесячно — или оставляйте его работающим бесконечно.
- 📊 Двойная визуализация:
-
- Линия CVD: Чистая, высокопроизводительная линия для выявления долгосрочных дивергенций и истощения тренда.
- Наложение гистограммы: Мгновенная визуальная обратная связь по давлению покупок/продаж на каждом баре для быстрого определения кульминации или поглощения.
- ⚡ Сверхлегкий: Написан с использованием нативной оптимизации C# для cTrader, обеспечивая отсутствие задержек даже на слабых машинах или в волатильных рынках.
- 🎯 Обнаружение дивергенций: Легко выявляйте, когда цена достигает новых максимумов, а CVD не подтверждает — классический признак институционального распределения.
Как торговать с ним
- Подтверждение тренда: Следите, чтобы линия CVD двигалась в том же направлении, что и цена.
- Поглощение: Когда цена достигает нового минимума, но гистограмма CVD показывает сильный «Delta Up» (зеленый), покупатели поглощают давление продаж.
- Истощение: Следите за резким всплеском на гистограмме (кульминация), за которым следует разворот линии CVD.
Параметры:
- Режим якорения: Никогда, ежедневно, еженедельно, ежемесячно.
- Показать дельту бара: Включить/выключить гистограмму.
Сводка
Key features include smart anchoring with multi-timeframe resets (daily, weekly, monthly, or continuous), dual visuals comprising a CVD line for spotting divergences and trend exhaustion, and a histogram overlay for immediate per-bar buying or selling pressure insights. The indicator is optimized in native C# for cTrader, ensuring high performance and low resource use.
Traders can use the indicator for trend confirmation by aligning CVD direction with price, identify absorption when price lows coincide with strong positive delta in the histogram, and detect exhaustion through histogram spikes followed by CVD reversals. Adjustable parameters include anchor mode and histogram display toggle.
This tool supports analysis across multiple markets and symbols, including Forex, cryptocurrencies, indices, commodities, and stocks.
Отзывы покупателей
5 | 0 % | |
4 | 100 % | |
3 | 0 % | |
2 | 0 % | |
1 | 0 % |


