
설명
WinSMC 사용자 가이드
1. 목적
`WinSMC`는 cTrader용 오버레이 SMC 지표입니다. 다음을 시각적으로 식별하는 데 도움이 됩니다:
- 시장 구조 변화
- `BOS` (구조 돌파)
- `MSS` (시장 구조 변화)
- `주문 블록`
- `유동성 스캔` / `스윕`
- `FVG` (공정 가치 갭)
자동 거래 시스템이 아닙니다. 확인 기반 거래에 가장 적합한 구조 및 컨텍스트 도구입니다.
2. 핵심 개념
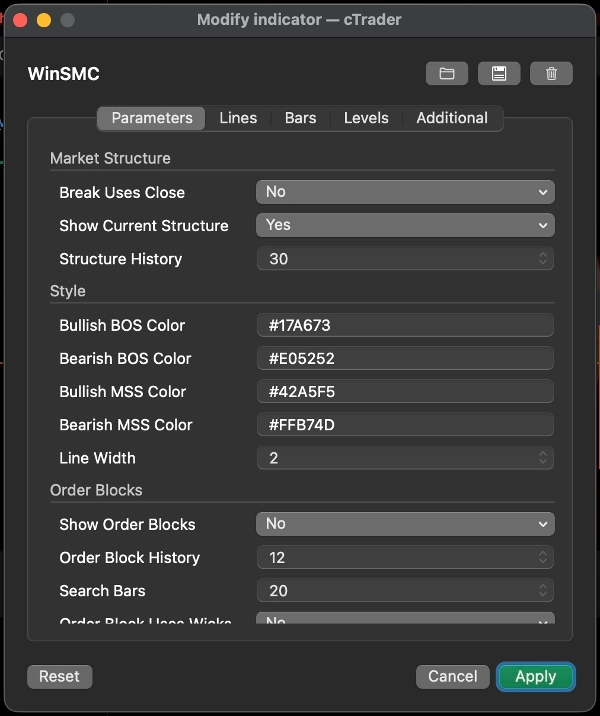
스윙 길이
`스윙 길이`는 피벗이 유효한 스윙 포인트로 간주되기 전에 좌우로 얼마나 확인되어야 하는지를 제어합니다.
실용적인 안내:
- 작은 값 = 신호 많음, 노이즈 많음
- 큰 값 = 신호 적음, 더 깨끗한 구조
돌파 시 종가 사용
이 설정은 구조 돌파가 다음 중 무엇으로 확인되는지를 결정합니다:
- `예`: 캔들 종가
- `아니오`: 심지/저가/고가 돌파
안내:
- 더 보수적인 접근을 위해 종가 사용
- 더 빠르고 민감한 감지를 위해 심지 돌파 사용
현재 구조 표시
현재 활성 스윙 고점 및 스윙 저점 라인을 표시하여 시장이 아직 존중하는 부분을 볼 수 있게 합니다.
구조 기록
차트에 유지되는 구조 돌파 라인과 레이블의 수를 제어합니다.
3. BOS 및 MSS
BOS
`BOS`는 가격이 같은 방향으로 계속 진행하며 이전 고점 또는 저점을 돌파함을 의미합니다.
일반적인 해석:
- 상승 추세에서는 이전 고점을 돌파하는 것이 강세 BOS입니다
- 하락 추세에서는 이전 저점을 돌파하는 것이 약세 BOS입니다
MSS
`MSS`는 시장이 이전 편향에서 방향을 변경했음을 의미합니다.
일반적인 해석:
- 가격이 약세였고 이전 고점을 돌파하면 강세 MSS입니다
- 가격이 강세였고 이전 저점을 돌파하면 약세 MSS입니다
거래 활용
- `BOS`는 추세 지속 지향적입니다
- `MSS`는 반전 지향적입니다
- 최상의 진입은 보통 `주문 블록` 또는 `FVG`의 재테스트에서 옵니다
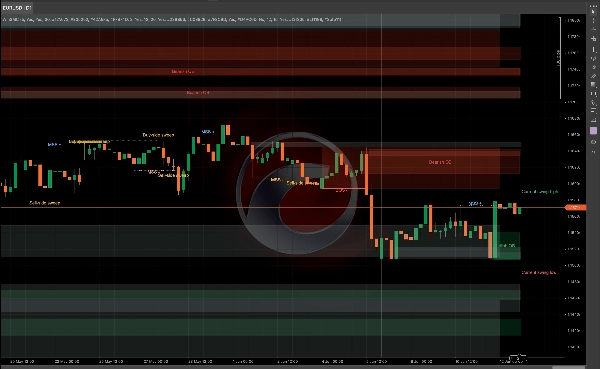
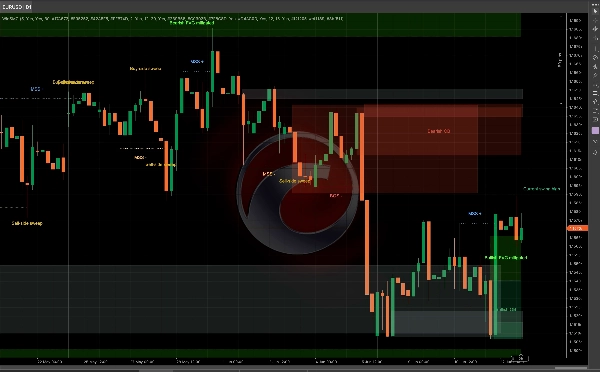
4. 주문 블록
`주문 블록`은 구조 돌파 전 마지막 반대 방향 캔들입니다. 일반적으로 공급/수요 반응 구역으로 취급됩니다.
주문 블록 표시
활성화하면, 지표는 `BOS` 또는 `MSS` 후에 뒤돌아보고 마지막 반대 방향 캔들 영역을 그립니다.
의미
- 강세 OB: 강세 돌파 후 마지막 약세 캔들 사용
- 약세 OB: 약세 돌파 후 마지막 강세 캔들 사용
가격이 영역과 상호작용하기 시작하면 완화된 것으로 표시됩니다.
주문 블록 심지 사용
이것은 박스가 얼마나 넓게 그려지는지를 제어합니다:
- `예`: 전체 캔들 범위 사용, 더 넓은 영역
- `아니오`: 더 좁은 핵심 영역 사용
안내:
- 더 넓고 보수적인 영역을 위해 `예` 사용
- 더 좁고 정밀한 영역을 위해 `아니오` 사용
주문 블록 전략
일반적인 작업 흐름:
1. `BOS` 또는 `MSS` 대기
2. 해당 OB 표시
3. 재테스트 대기
4. 진입 전 확인 찾기
OB를 확실한 반전 지점으로 취급하지 마십시오. 이는 고관심 영역일 뿐 확실한 것은 아닙니다.
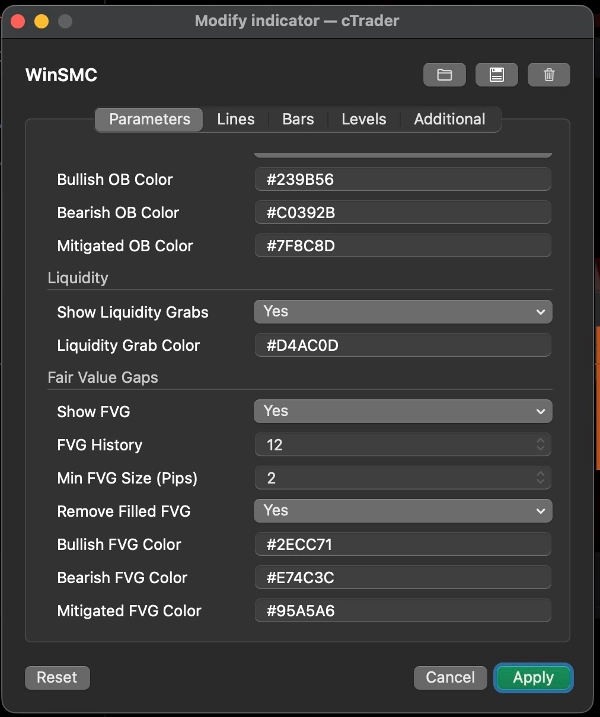
5. 유동성 스캔 / 스윕
`유동성 스캔`은 가격이 이전 고점 위나 이전 저점 아래로 달려간 후 다시 내부로 닫히는 것을 의미합니다.
이 지표에서:
- `매수 측 스윕`: 가격이 이전 고점을 넘었다가 다시 그 아래로 닫힘
- `매도 측 스윕`: 가격이 이전 저점을 넘었다가 다시 그 위로 닫힘
이는 보통 시장이 유동성을 확보했고 다음 움직임을 준비하고 있음을 의미합니다.
중요
스윕 자체는 거래 신호가 아닙니다.
다음과 같이 취급하는 것이 좋습니다:
- 유동성이 확보되었다는 경고
- 설정 힌트
- `MSS` 또는 `BOS` 대기 이유
일반적인 사용
- `매수 측 스윕` 후, 약세 `MSS`는 숏 설정을 지원할 수 있습니다
- `매도 측 스윕` 후, 강세 `MSS`는 롱 설정을 지원할 수 있습니다
6. FVG
`FVG`는 세 개의 캔들 불균형으로 생성된 공정 가치 갭입니다.
FVG 표시
활성화하면, 지표가 눈에 보이는 FVG 영역을 그립니다.
감지 규칙
- 강세 FVG: 첫 번째 캔들 고가가 세 번째 캔들 저가 아래에 있음
- 약세 FVG: 첫 번째 캔들 저가가 세 번째 캔들 고가 위에 있음
최소 FVG 크기 (핍)
작은 갭을 필터링합니다.
- 단위: `핍`
- 값이 높을수록 적지만 더 의미 있는 FVG
- `0` = 크기 필터 없음
차트가 복잡하거나 1픽셀 크기의 작은 갭이 작업 흐름에 유용하지 않을 때 유용합니다.
채워진 FVG 제거
활성화하면, 완전히 채워진 FVG가 차트에서 제거됩니다.
FVG 전략
두 가지 일반적인 접근법:
1. 추세 되돌림
- `BOS` 또는 `MSS` 대기
- 가격이 FVG로 되돌림 대기
- 구조 방향으로 거래
2. 확인 기반 진입
- 스윕 관찰
- `MSS` 대기
- FVG를 최종 되돌림 영역으로 사용
7. 권장 거래 스타일
전략 A: 추세 지속
시장이 명확하게 추세를 보일 때 가장 좋습니다.
작업 흐름:
1. `BOS` 대기
2. OB 표시
3. OB 또는 FVG로 되돌림 찾기
4. 가격 반응 후에만 진입
이는 고전적인 추세 추종 접근법입니다.
전략 B: 스윕 후 반전
시장이 변동성이 크고 거짓 돌파가 잦을 때 가장 좋습니다.
작업 흐름:
1. `매수 측 스윕` 또는 `매도 측 스윕` 감지
2. 반대 `MSS` 대기
3. 되돌림 영역으로 OB 또는 FVG 사용
4. 확인 후 진입
이는 스윕 단독 거래보다 더 강력합니다.
전략 C: 스윕 + MSS + OB/FVG 합류
이것은 지표를 사용하는 가장 깔끔한 방법 중 하나입니다.
작업 흐름:
1. 스윕 획득
2. MSS 획득
3. OB 또는 FVG 재테스트 대기
4. 영역이 겹칠 때만 거래
이는 조기 진입을 줄여줍니다.
8. 빠른 설정 제안
- `스윙 길이`: 5 또는 7부터 시작
- `돌파 시 종가 사용`: 더 보수적인 관점을 위해 켜기
- `주문 블록 심지 사용`: 더 넓은 영역을 위해 켜기
- `최소 FVG 크기 (핍)`: 2.0부터 시작하고 상품별로 조정
- `구조 기록` / `주문 블록 기록` / `FVG 기록`: 차트 가독성을 위해 조정
9. 최종 메모
`WinSMC`는 단일 신호 트리거가 아니라 구조 맵으로 사용하는 것이 가장 좋습니다.
가장 신뢰할 수 있는 작업 흐름은 다음과 같습니다:
- 추세 방향 식별
- 유동성 스윕 관찰
- MSS 또는 BOS 대기
- 진입 영역으로 OB 또는 FVG 사용
- 확인 후에만 진입
요약
The indicator helps traders analyze price action by marking swing highs and lows, confirming valid swing points based on customizable swing length, and distinguishing breaks using candle closes or wick extremes. Order Blocks are displayed as supply/demand zones derived from the last opposite candle before a structure break, with options to adjust zone width. Liquidity Sweeps indicate price movements beyond prior highs or lows that close back inside, signaling potential setups rather than direct trade signals. FVG zones are identified by three-candle imbalances and can be filtered by minimum size and removed once filled.
WinSMC supports multiple trading strategies, including trend continuation after BOS, reversal setups following liquidity sweeps and MSS, and confluence-based entries combining sweeps, MSS, and retests of Order Blocks or FVGs. It is intended as a confirmation and structure mapping tool rather than an automated trading system, aiding traders in timing entries with contextual market information.

!["[CB] Pivot Points Pro" 로고](https://cdn.ctrader.com/image/webp/43463c82-67b0-4f10-a4ba-901bba091d81_32594)


