MARCs_MARKET_OVERVIEW_PRO
Indikator
Versi 1.0, Aug 2026
Windows, Mac
Trading product for MARCs_MARKET_OVERVIEW_PRO Indikator Key Levels RSI, image 2
Trading product for MARCs_MARKET_OVERVIEW_PRO Indikator Key Levels RSI, image 3
Trading product for MARCs_MARKET_OVERVIEW_PRO Indikator Key Levels RSI, image 4
Trading product for MARCs_MARKET_OVERVIEW_PRO Indikator Key Levels RSI, image 5
Trading product for MARCs_MARKET_OVERVIEW_PRO Indikator Key Levels RSI, image 6
Trading product for MARCs_MARKET_OVERVIEW_PRO Indikator Key Levels RSI, image 7
Trading product for MARCs_MARKET_OVERVIEW_PRO Indikator Key Levels RSI, image 8
Trading product for MARCs_MARKET_OVERVIEW_PRO Indikator Key Levels RSI, image 9
Trading product for MARCs_MARKET_OVERVIEW_PRO Indikator Key Levels RSI, image 10
Sejak 24/06/2026
1
Instal gratis

Deskripsi

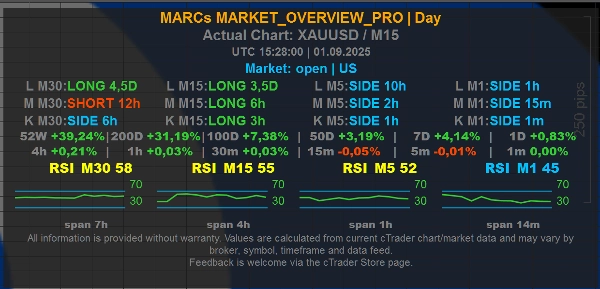
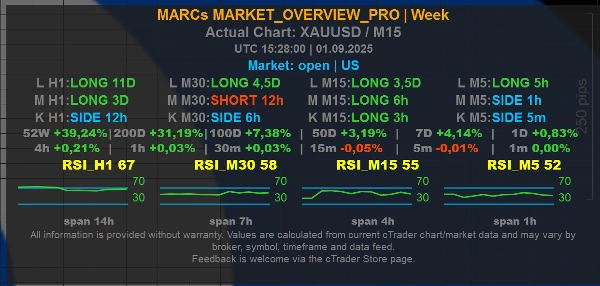
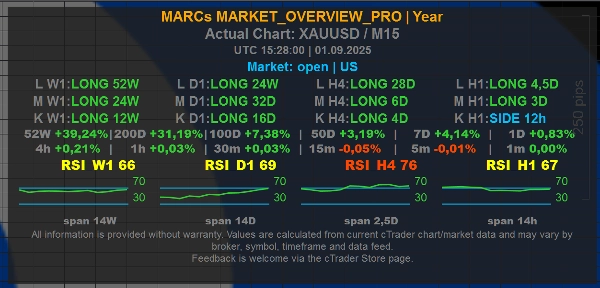
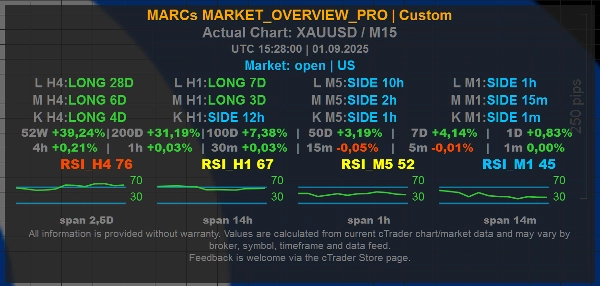
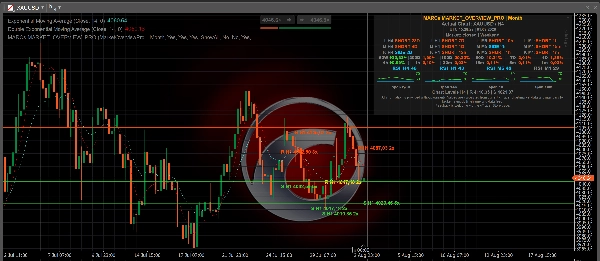
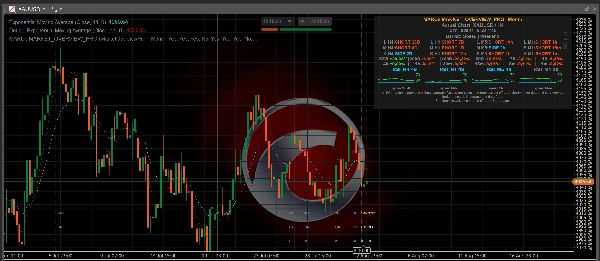
MARCs MARKET_OVERVIEW_Pro is a multi-timeframe market overview indicator for cTrader.


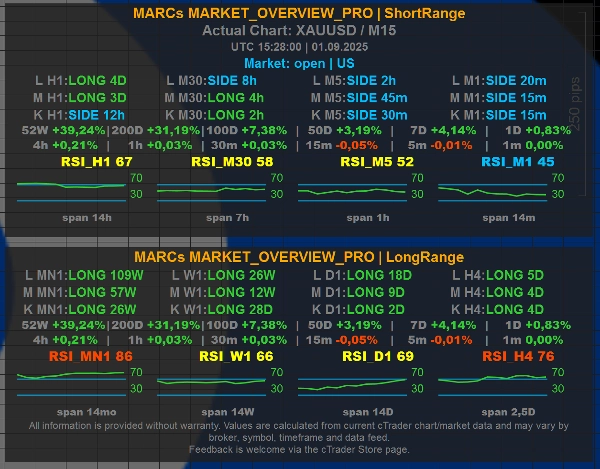
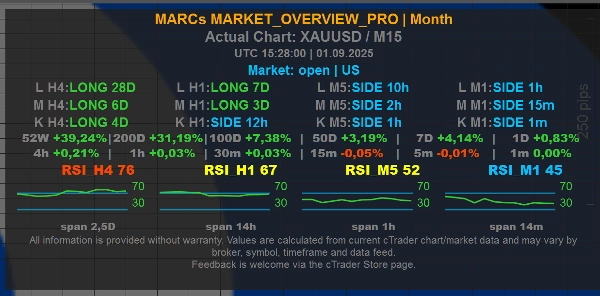
It displays a compact on-chart dashboard with trend context, RSI readings, market/session information and configurable time-horizon presets. The indicator was originally developed around XAUUSD / Gold analysis, but is designed to work as a general market overview tool on any available chart symbol, depending on broker data quality and available market history.


Main features:

- Multi-timeframe trend rows for short, medium and long market context

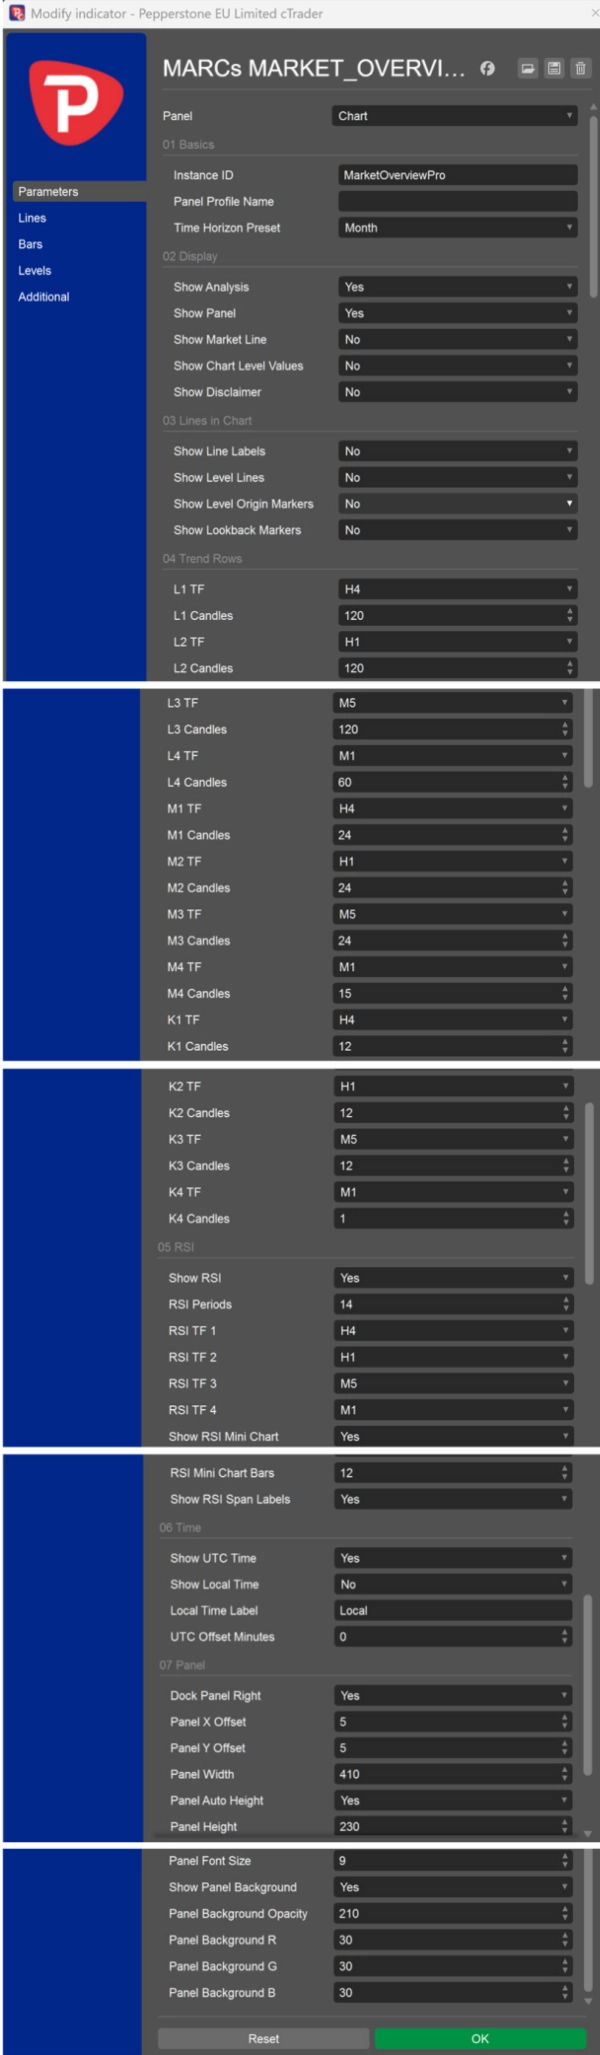
- Configurable Day, Week, Month, Year, ShortRange, LongRange and Custom presets

- RSI values and mini RSI charts across selected timeframes

- Optional UTC and local time display

- Optional market/session line

- Optional chart-level reference lines

- Optional chart-level values shown directly in the panel


Level Lines and Chart Level Values:

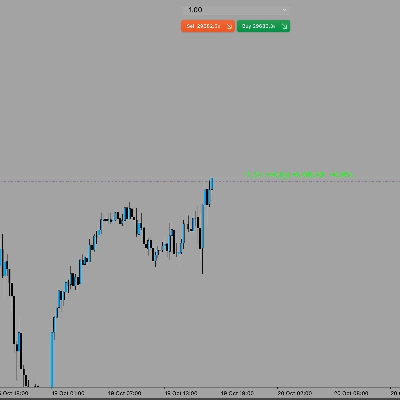
The optional Show Level Lines setting can display calculated chart reference levels from one selected timeframe: M1, M5, M15, M30, H1, H4, D1, W1 or MN1. For these individual timeframe selections, the indicator shows the nearest calculated resistance above the current price and the nearest calculated support below the current price. ShowAll displays the broader H1 level set from the existing H1 level calculation. No keeps level lines hidden.


The optional Show Chart Level Values setting can show the same nearest resistance/support reference values directly in the panel without drawing lines on the chart. The panel line is labelled, for example, "Chart Levels H1 | R ... | S ..." to make clear that the values refer to chart-level references.


How Level Lines are calculated:

The levels are derived from past swing highs and swing lows in the selected timeframe. Nearby swing points are grouped into level clusters, and only areas with enough repeated touches are shown. This makes the lines visual market-context markers based on available chart history.


Important:

MARCs Market Overview Pro is an analysis-only market overview tool. It does not place trades, manage positions, provide investment advice or guarantee trading results.


Level Lines are not buy signals, sell signals, stop-loss recommendations, take-profit recommendations or investment advice. They do not predict that price will reverse, break out or react at a specific level.


All readings depend on the available cTrader chart data, broker symbol feed, timeframe and market history. Values may differ between brokers, symbols and data feeds.


Trading involves risk. Past performance does not guarantee future results.

Ringkasan

Ringkasan AI
MARCs MARKET_OVERVIEW_Pro is a multi-timeframe market overview indicator designed for the cTrader platform. It provides a compact on-chart dashboard that displays trend context across short, medium, and long timeframes, RSI values with mini RSI charts, and market/session information. Users can configure time-horizon presets including Day, Week, Month, Year, ShortRange, LongRange, and Custom settings.
The indicator supports optional display of UTC and local times, market/session lines, and chart-level reference lines. These reference lines represent calculated support and resistance levels derived from clusters of past swing highs and lows on selected timeframes ranging from 1 minute to monthly intervals. Users can choose to show these levels as lines on the chart or as numeric values within the dashboard panel.
Originally developed with a focus on XAUUSD (Gold), MARCs MARKET_OVERVIEW_Pro is adaptable to any chart symbol supported by the broker’s data feed and market history. It serves as an analysis tool providing visual market structure and momentum insights but does not execute trades or offer trading advice. The indicator’s readings depend on the quality and availability of broker data and chart history.
Profil indikator
Kategori indikator
Struktur pasar (SMC)
Tipe output
Visualisasi
Filter
Persyaratan data
Hanya batang
Sinyal yang didukung
Kekuatan tren
Level tersentuh

Ulasan pelanggan

0.0
Ulasan: 0
Ulasan pelanggan
Belum ada ulasan untuk produk ini. Sudah mencobanya? Jadilah pemberi ulasan pertama!

Diskusi

Pertanyaan umum

Key Levels
RSI
Market Structure
Risk Dashboard
Support & Resistance
Produk-produk yang tersedia melalui cTrader Store, termasuk bot trading, indikator, dan plugin, disediakan oleh pengembang pihak ketiga serta hanya ditujukan untuk akses teknis dan informasi. cTrader Store bukan broker dan tidak menyediakan saran investasi, rekomendasi pribadi, atau jaminan apa pun tentang kinerja di masa mendatang.

Produk lain dari penulis ini

Indikator
RSI
Key Levels
+3
MARKs Free XAUUSD market overview dashboard with trend rows, RSI context, sessions and fixed Day/Month presets.
cBot
Conservative
Fixed Risk %
+5
MARCs GOLD H4-Gold-Swing-Bot for XAUUSD with transparent long-term backtests and optional reserve/guard system.
3.01
Faktor laba

Anda mungkin juga suka

Indikator
Prop
Forex
+4
A precision-crafted indicator that compares current volume to its historical average for the same time of day.
Indikator
ATR
BOS
+5
Full ICT/SMC 4-step setup checker that alerts a long or short setup.
Indikator
BOS
CHOCH
+5
A professional-grade cTrader indicator for traders following the Inner Circle Trader (ICT) methodology. It replaces 6–8
Indikator
Prop
Forex
+12
Identify and trade breakouts with Consolidation Zones! Visualize price consolidation areas for trading opportunities.
Logo "ATR Bands"
Populer
4.6
(3)
$19
Indikator
ATR
Prop
+13
Enhance trading with ATR Bands! Visualize market volatility using dynamic upper and lower ATR bands for precise decision
Indikator
ATR
RSI
+6
Market structural patterns , specifically the concepts of Change of Character (ChoCH) šŸ”„ and Break of Structure (BoS) šŸ’„
Indikator
ZigZag
Indices
+2
Auto Trendlines, Fibonacci, Pitchfork and Patterns from non‑repainting pivots. One‑click Presets, targeted Alerts, and a
Indikator
VWAP
Volume
+5
Institutional Session VWAP + 3-Sigma Bands & HUD. Engineered for high-precision Index & Prop Firm Scalping.
Indikator
SMC
Forex
+7
Simple Smart Money Concepts (SMC)
Indikator
EMA
RSI
+5
MACD Colour Histogram with 11 Moving Average Types, Multi-timeframe confirmation and Sound Signal Alert.
Indikator
ATR
Volume
+1
The UT Bot identify potential trend reversals and momentum shifts.
Logo "ORB v1"
Populer
5.0
(2)
$19
Indikator
Breakout
Opening Range Breakout (ORB) - Visual Edition
Indikator
Auto Fibonacci Retracement Indicator for cTrader
Indikator
ATR
Forex
+3
LevelMaster S/R: Pinpoint key support & resistance zones with precision. Perfect for traders of all levels Trade smarter
Indikator
RSI
XAUUSD
+2
Automatic ZigZag swings with dynamic support & resistance levels, labeling highs/lows for clear trend signals.
Indikator
JMA-like is a highly responsive and ultra-smooth moving average designed to replicate the behavior of the original JMA!
Indikator
MSS
AI-assisted
+5
Live ICT Silver Bullet detection: liquidity sweeps, structure shifts, and killzone-gated FVGs, graded and glowing in rea
Indikator
MCDX is a powerful and innovative indicator.

Harga

Sejak 24/06/2026
1
Instal gratis