


Mô tả
Ý TƯỞNG
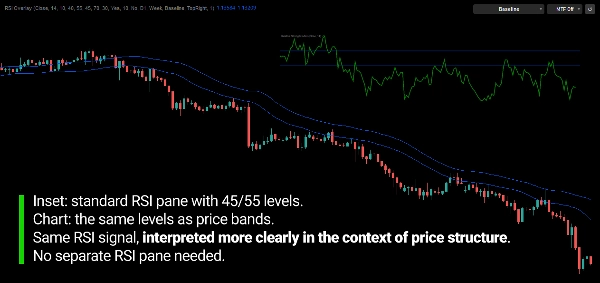
Một RSI chuyển đổi các mức của nó thành giá và vẽ trực tiếp lên biểu đồ, giữ động lượng và giá trong cùng một không gian thay vì một khung riêng biệt.
VẤN ĐỀ
RSI thường được đọc trong một khung riêng biệt.
Để sử dụng nó, bạn phải liên tục so sánh giá trị dao động với những gì giá đang làm trên biểu đồ chính.
Các mức như 70, 30 hoặc 50 là các con số trên bộ dao động. Chúng không cho bạn biết giá cần ở đâu để RSI đạt đến các mức đó.
Vì vậy, bạn phải liên tục dịch bằng mắt: "RSI đang ở mức 62 — mức đó ở đâu trên biểu đồ?"
Vấn đề không phải là RSI tự nó.
Vấn đề là động lượng và giá được hiển thị ở hai nơi khác nhau, với hai đơn vị khác nhau.
KHÁI NIỆM CỐT LÕI: CÁC MỨC RSI TRỞ THÀNH CÁC MỨC GIÁ.
RSI truyền thống hỏi:
"Giá trị RSI hiện tại là bao nhiêu?"
RSI Overlay hỏi:
"Ở mức giá nào RSI sẽ đạt đến mức này?"
Mỗi mức RSI được chuyển đổi thành mức giá tương ứng và được vẽ trực tiếp trên biểu đồ.
Bộ dao động không còn là thứ bạn đọc trong một cửa sổ rồi dịch sang cửa sổ khác.
Thông tin của nó được biểu thị trên cùng thang đo giá với chuyển động mà bạn đang phân tích.
RSI đặt mức. Biểu đồ hiển thị nó bằng giá.
NÓ LÀM GÌ
RSI Overlay chuyển đổi các tham chiếu RSI được chọn thành các mức giá động và hiển thị chúng trực tiếp trên biểu đồ chính.
Các đường cơ sở Bull và Bear, các mức Quá Mua và Quá Bán, cùng hai tham chiếu dựa trên RSI là Smoothed RSI và Averaged RSI, đều được biểu diễn dưới dạng các đường giá.
Các đường này được cập nhật với mỗi thanh mới, vì vậy chúng tiếp tục phản ánh trạng thái RSI mới nhất thay vì giữ cố định ở một mức giá lịch sử.
Đây không phải là các mức hỗ trợ hoặc kháng cự thông thường.
Chúng đại diện cho mức giá mà giá trị RSI tương ứng sẽ đạt được theo phép tính RSI hiện tại.
Chỉ báo không cố gắng dự đoán giá sẽ đi đâu.
Nó cho thấy giá đứng ở đâu so với các mức RSI mà bạn đang quan sát.
CÁCH NÓ HOẠT ĐỘNG
- RSI được tính toán bằng cách làm mượt Wilder.
- Mỗi mức RSI được chuyển đổi thành mức giá sẽ tạo ra nó.
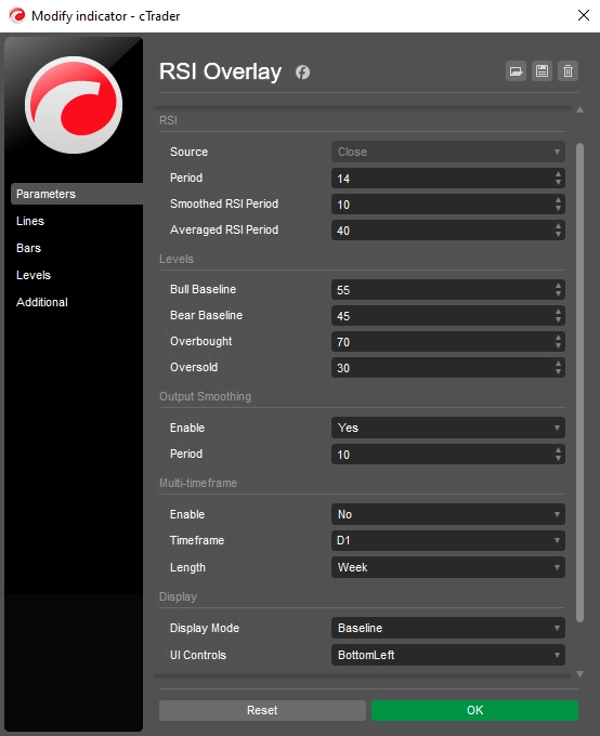
- Các đường cơ sở Bull và Bear đánh dấu vùng động lượng quanh đường trung tâm (mặc định 55 / 45).
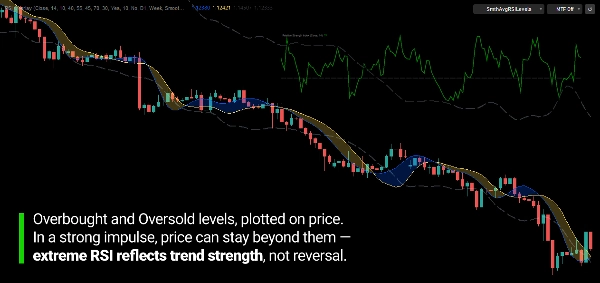
- Các mức Quá Mua và Quá Bán được chuyển đổi theo cách tương tự (mặc định 70 / 30).
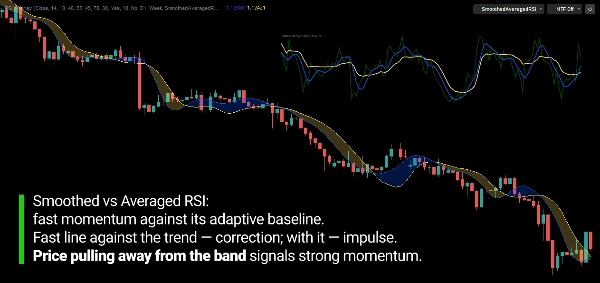
- Smoothed RSI và Averaged RSI cũng được chuyển đổi thành các đường giá.
CÁC THAM CHIẾU RSI
Đường cơ sở Bull / Bear
Các mức giá mà tại đó RSI sẽ bước vào vùng động lượng tăng hoặc giảm. Khoảng cách giữa chúng cho thấy động lượng đang ở trạng thái trung lập.
Smoothed RSI
Phiên bản giảm nhiễu của RSI, được hiển thị dưới dạng đường giá phản ứng mượt mà hơn.
Averaged RSI
Trung bình thích ứng chậm hơn của RSI, được hiển thị dưới dạng đường giá. Nó cung cấp tham chiếu động lượng ổn định hơn.
Quá Mua / Quá Bán
Các mức giá mà tại đó RSI sẽ đạt đến ngưỡng quá mua và quá bán.
Các tham chiếu này không phải là tín hiệu tự động.
Vị trí của chúng so với giá và với nhau cung cấp bối cảnh về cách động lượng đang phát triển.
BỐI CẢNH ĐA KHUNG THỜI GIAN
RSI không nhất thiết phải lấy từ khung thời gian biểu đồ bạn đang xem.
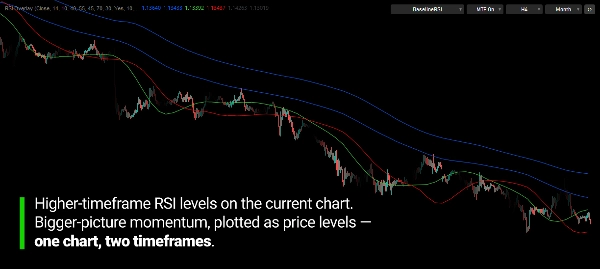
Ví dụ, RSI hàng tuần hoặc hàng tháng có thể được chiếu lên biểu đồ H1.
Điều này đặt khung động lượng khung thời gian cao hơn trực tiếp lên hành động giá bạn đang quan sát.
Bạn chọn bao nhiêu lịch sử được vẽ, từ giờ cuối cùng đến vài năm.
Khung thời gian được chọn phải cao hơn khung thời gian biểu đồ.
KIỂM SOÁT TỪ BIỂU ĐỒ
Mười một chế độ hiển thị cho phép bạn chỉ hiển thị những gì bạn cần, từ một cặp đường cơ sở sạch đến bộ đầy đủ các tham chiếu RSI.
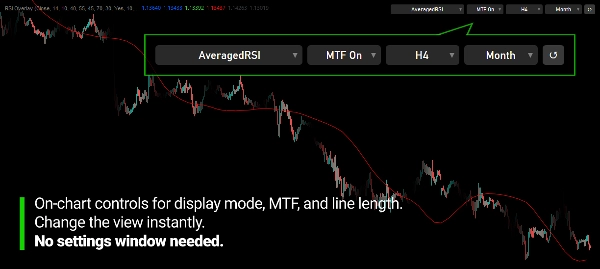
Thanh điều khiển nhỏ gọn trên biểu đồ cho phép bạn chuyển đổi chế độ hiển thị, bật hoặc tắt đa khung thời gian, và thay đổi khung thời gian và độ dài mà không cần mở lại cài đặt.
Nút đặt lại trả mọi thứ về các tham số ban đầu của bạn.
Thanh có thể được đặt ở bất kỳ góc nào hoặc ẩn đi.
NHỮNG GÌ BẠN CÓ THỂ QUAN SÁT
Chỉ báo được thiết kế để làm cho một số điều trở nên rõ ràng:
- Giá đứng ở đâu so với các vùng động lượng tăng và giảm
- Khoảng cách giá so với các mức quá mua và quá bán, theo đơn vị giá
- Sự thay đổi động lượng quanh các đường cơ sở
- Sự điều chỉnh và tiếp tục so với RSI làm mượt và trung bình
- Bối cảnh động lượng khung thời gian cao hơn trên biểu đồ khung thời gian thấp hơn
RSI Overlay là công cụ đo lường, không phải hệ thống mua/bán độc lập.
ĐƯỢC XÂY DỰNG CHO ĐỘNG LỰC THEO ĐƠN VỊ GIÁ
Mục đích không phải để thay thế RSI.
Mà là để loại bỏ nhu cầu dịch bộ dao động trở lại thành giá bằng mắt thường.
Mọi thứ bạn biết về RSI vẫn áp dụng. Nó chỉ được hiển thị nơi các quyết định thực sự được đưa ra: trên biểu đồ giá.
TÍNH NĂNG CHÍNH
- Các mức RSI được chuyển đổi thành các mức giá trên biểu đồ chính
- Đường cơ sở Bull và Bear (mặc định 55 / 45)
- Các mức giá Quá Mua và Quá Bán (mặc định 70 / 30)
- Đường RSI làm mượt
- Đường RSI trung bình
- RSI đa khung thời gian trên các biểu đồ khung thời gian thấp hơn
- Độ dài hiển thị có thể chọn cho các đường đa khung thời gian
- 11 chế độ hiển thị
- Thanh điều khiển trên biểu đồ có nút đặt lại
- Nguồn, chu kỳ RSI, làm mượt và trung bình có thể cấu hình
- Màu sắc, kiểu đường và độ dày có thể tùy chỉnh
---
Giao dịch có rủi ro. Chỉ báo này là công cụ phân tích kỹ thuật và nên được sử dụng cùng với quản lý rủi ro phù hợp.
Tóm tắt
It supports multi-timeframe analysis by allowing RSI data from higher timeframes (e.g., weekly or monthly) to be displayed on lower timeframe charts, providing broader momentum context. Users can customize display modes, line styles, colors, and control parameters directly from an on-chart control bar, which includes options to reset settings and adjust timeframe and length without reopening menus.
RSI Overlay serves as a measurement tool to visualize where price stands relative to momentum zones and RSI thresholds in price terms. It does not generate automatic trading signals but aids in observing momentum shifts, pullbacks, and continuations aligned with RSI levels on the price chart.
Đánh giá của khách hàng
5 | 100 % | |
4 | 0 % | |
3 | 0 % | |
2 | 0 % | |
1 | 0 % |
Thảo luận
Câu hỏi thường gặp























Giá