
Description
Candles Volume Delta est un indicateur puissant et visuellement intuitif qui transforme le volume brut des ticks en informations exploitables pour le trading. En colorant les barres de prix en fonction de la pression du volume d'achat/vente, il fournit un indice visuel immédiat du sentiment et de la force du marché, vous aidant à repérer d'un coup d'œil les potentielles continuations ou inversions de tendance.
Fonctionnalités clés
-
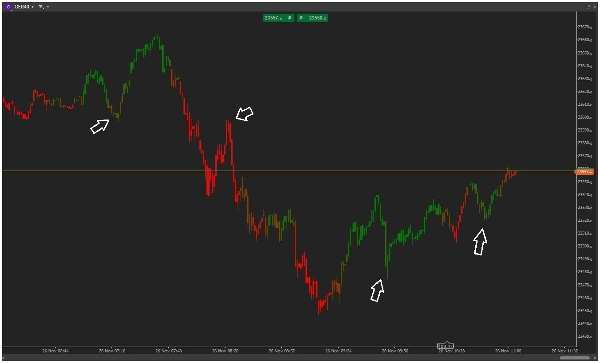
- 🟢 Analyse Visuelle du Volume : Colore chaque barre de prix selon la dominance du volume d'achat/vente
- 📊 Calcul Intelligent du Delta : Calcule le delta de volume sur une période définie par l'utilisateur
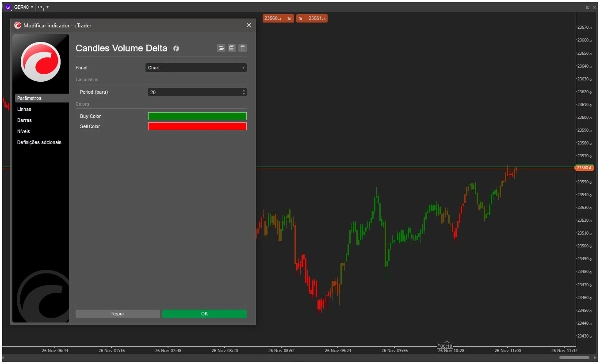
- 🎨 Couleurs Personnalisables : Schémas de couleurs d'achat/vente entièrement ajustables
- ⚡ Traitement en Temps Réel : Optimisé pour un retour visuel instantané sur les nouvelles barres
- 🛠️ Installation Facile : Configuration simple avec des paramètres par défaut pertinents
Comment ça fonctionne
Candles Volume Delta analyse le volume des ticks sur la période spécifiée (par défaut : 20 barres) et calcule le pourcentage de volume d'achat par rapport au volume de vente :
-
- Barres Vertes : Forte pression d'achat (typiquement >60% de volume d'achat)
- Barres Rouges : Forte pression de vente (typiquement <40% de volume d'achat)
- Couleurs en Dégradé : Transitions de couleurs douces montrant des niveaux intermédiaires de force
L'indicateur utilise un lissage basé sur l'ATR pour garantir des signaux stables et significatifs qui s'adaptent à la volatilité actuelle du marché.
Applications de trading
-
- Confirmation de tendance : Valider la force de la tendance avec la confirmation du volume
- Signaux de retournement : Repérer les retournements potentiels lorsque l'action des prix contredit le flux de volume
- Validation de cassure : Confirmer les cassures avec des preuves de volume à l'appui
- Sentiment du marché : Évaluer la dominance globale des acheteurs/vendeurs sur n'importe quelle période
Pourquoi choisir Candles Volume Delta ?
Contrairement aux indicateurs de volume complexes qui encombrent votre graphique, Candles Volume Delta offre un retour visuel immédiat grâce à un codage couleur simple. Il est léger, rapide, et vous fournit les informations essentielles sur le volume dont vous avez besoin sans surcharge de données.
Parfait pour les traders qui souhaitent :
-
- Évaluation rapide du sentiment du marché
- Analyse claire et non encombrée du graphique
- Confirmation visuelle des mouvements de prix
- Intégration facile dans les stratégies existantes
Installez-le aujourd'hui et voyez les marchés à travers la dynamique du volume !
Résumé
Key features include customizable color schemes, real-time processing for instant visual feedback, and easy setup with sensible defaults. The indicator helps traders quickly assess market sentiment, confirm trends, identify potential reversals, validate breakouts, and gauge buyer/seller dominance across timeframes. It is designed to provide essential volume insights without cluttering the chart, making it suitable for integration into various trading strategies, including scalping and trend analysis. Supported markets include indices and other instruments where volume analysis is relevant.
Avis clients
5 | 100 % | |
4 | 0 % | |
3 | 0 % | |
2 | 0 % | |
1 | 0 % |


