
説明
注意:cTrader Windowsのみでテスト済みです。
LT_FairValueGap は、精密なプライスアクショントレーダー向けに設計された軽量で強力なフェアバリューギャップインジケーターです。厳密な3本のバーのロジックを使用して機関投資家スタイルのアンバランスゾーンを強調表示し、価格がギャップを再訪した際にそれらを除去します。これにより、エントリー、エグジット、またはコンフルエンスのためのクリーンで実用的なゾーンを提供します。
🔍 仕組み
- 強い中間ローソク足(大きな実体)が隣接する2本のローソク足の間にアンバランスを作り出すと、フェアバリューギャップ(FVG) が識別されます。
- ギャップは一時的な サポート/レジスタンスゾーン(SR) としてマークされます。
- 価格が戻ってギャップを埋めると、そのゾーンはもはや拡張されず、チャートが散らからず関連性を保ちます。
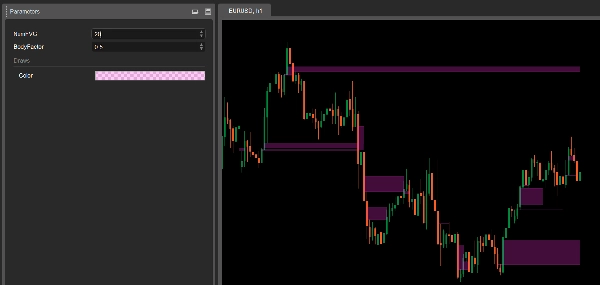
⚙️ パラメーター
- NumFVG:チャートに表示するFVGゾーンの最大数。
- BodyFactor:中間バーの強度閾値(デフォルト:
2.0×過去20本のバーの平均実体)。
✅ 主な特徴
- 機関投資家スタイルのギャップ検出(3本バーのロジック)
- クリーンなチャート表示 — ヒットしたらゾーンの拡張を停止
- BodyFactorによる感度調整可能
- プラグアンドプレイ:最小限の設定
📌 使用例
- 機関投資家のアンバランスと反応ゾーンを特定する
- エントリーのコンフルエンスや無効化マーカーとして使用する
- スイング構造やボリュームツールと組み合わせる
ブレイクアウト、ミティゲーション、リバーサルのいずれを取引する場合でも、LT_FairValueGap はノイズなしで重要な真のアンバランスゾーンを見つけるのに役立ちます。
概要
インジケーターのプロフィール
カスタマーレビュー
5.0
レビュー: 1
5 | 100 % | |
4 | 0 % | |
3 | 0 % | |
2 | 0 % | |
1 | 0 % |
カスタマーレビュー
June 25, 2025
Ngl, market notes are quicker to compare and that is enough to keep testing it. It should not replace the chart.
ディスカッション
よくあるご質問
Forex
cTrader Storeで入手可能な取引ボット、インジケーター、プラグインなどの商品は、第三者の開発者が提供するものであり、情報と技術の取得のみを目的としてご利用いただけます。cTrader Storeはブローカーではなく、投資助言や個人的な推奨を行うことも、将来のパフォーマンスを保証することもありません。


これも好きかも


価格
登録日 25/09/2024
34
販売