
説明
The Simple ICT Concepts Indicatorは、トレーダーがInner Circle Trader(ICT)メソッドの原則を適用するのを支援するために設計された強力なツールです。このインジケーターは、流動性レベル、サポートとレジスタンス、市場構造などの重要なゾーンの特定に焦点を当てており、プライスアクションおよびスマートマネーコンセプトのトレーダーにとって非常に価値のある資産となっています。
主な特徴
市場構造:
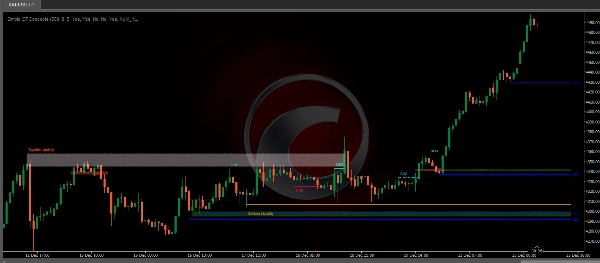
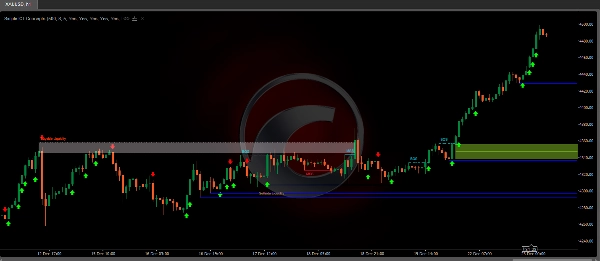
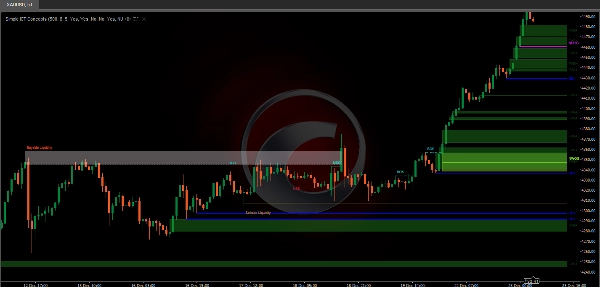
市場構造ラベルは、価格が以前のスイングポイントを突破することで構築されます。これにより、ユーザーはプライスアクションに基づいて現在の市場トレンドを判断できます。含まれる市場構造ラベルには2種類あります:市場構造シフト(MSS)構造の破壊(BOS)MSSは、上昇トレンドで価格がスイングローを破るか、下降トレンドでスイングハイを破ると発生し、潜在的な反転を示します。これはしばしば「CHoCH」とラベル付けされますが、ICTではMSSと指定されています。一方、BOSラベルは、上昇トレンドで価格がスイングハイを破るか、下降トレンドでスイングローを破ると発生します。これらの特定のスイングポイントの発生は、リトレースメント(誘因)によって引き起こされ、下位時間枠での流動性狩りを強調します。重要なスイングポイント:高値更新(HH)と安値更新(LL)、高値切り上げ(HL)と安値切り下げ(LH)変位:変位は、価格が同じセンチメント(強気/弱気)の連続したローソク足を大きな実体と短い影で形成するシナリオです。これらは、正の自己相関(終値から始値への変化が同じ符号の変化に続く可能性が高い)やボラティリティクラスタリング(大きな変化の後に大きな変化が続く)によってより技術的に識別できます。変位は、不均衡や市場構造の形成の原因となることがあり、これらはメタオーダーの完全な実行によって引き起こされることがあります。ボリューム不均衡:ボリューム不均衡(V.I.)は、ローソク足の実体が存在しない価格領域がある場合に発生します。ウィックの重なりに上下の動きはありますが、ボリュームの大部分がローソク足の実体にあるため、これをボリューム不均衡と呼びます。オーダーブロック:ICT(Inner Circle Trader)のオーダーブロックは、大規模な機関投資家が重要な買いまたは売り注文を出すチャート上の価格領域です。オーダーブロックはトレーディングの重要な概念であり、トレーダーが潜在的なサポートおよびレジスタンスレベルを特定し、価格の反転を予測するのに役立ちます。流動性:買い側/売り側の流動性レベルは、市場参加者がリミット/ストップ注文を配置する可能性のある価格レベルを示します。買い側の流動性レベルはショートトレーダーのストップロス注文およびロングトレーダーのリミット注文をまとめ、売り側の流動性レベルはロングトレーダーのストップロス注文およびショートトレーダーのリミット注文をまとめます。これらのレベルは異なる役割を果たすことがあります。より情報に精通した市場参加者はこれらのレベルを流動性の源として見なし、特定のレベル上の流動性が減少すると別の領域で見つかります。FVG/IFVG:フェアバリューギャップ:中央のローソク足に隣接するローソク足の影が重ならない3本のローソク足の形成で、ギャップ領域を示します。インプライドフェアバリューギャップ:フェアバリューギャップとは異なり、インプライドフェアバリューギャップは中央のローソク足に隣接するローソク足の影が重なっています。ギャップ領域は、それぞれの影とローソク足の最も近い端との平均から構成されます。バランスの取れた価格帯:バランスの取れた価格帯は、フェアバリューギャップが以前のフェアバリューギャップと重なり、その重なり部分が不均衡領域となる場合に発生します。NWOG/NDOG:このインジケーターは新週オープニングギャップ(NWOG)と新日オープニングギャップ(NDOG)を表示します。NWOGは金曜日の終値と日曜日の始値の間のギャップです。NDOGは前日の始値と終値の間のギャップです。
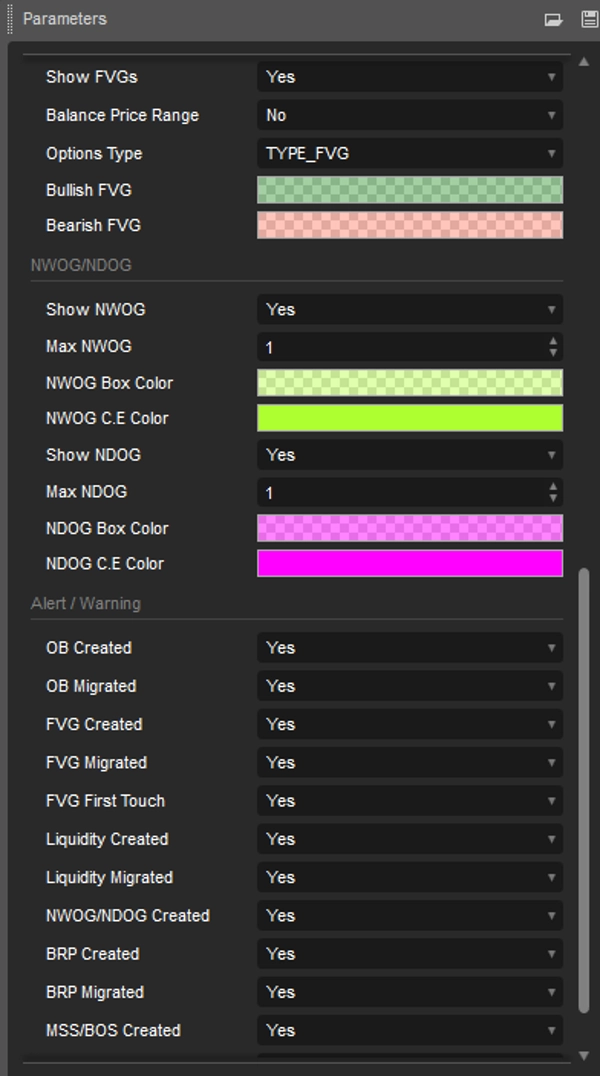
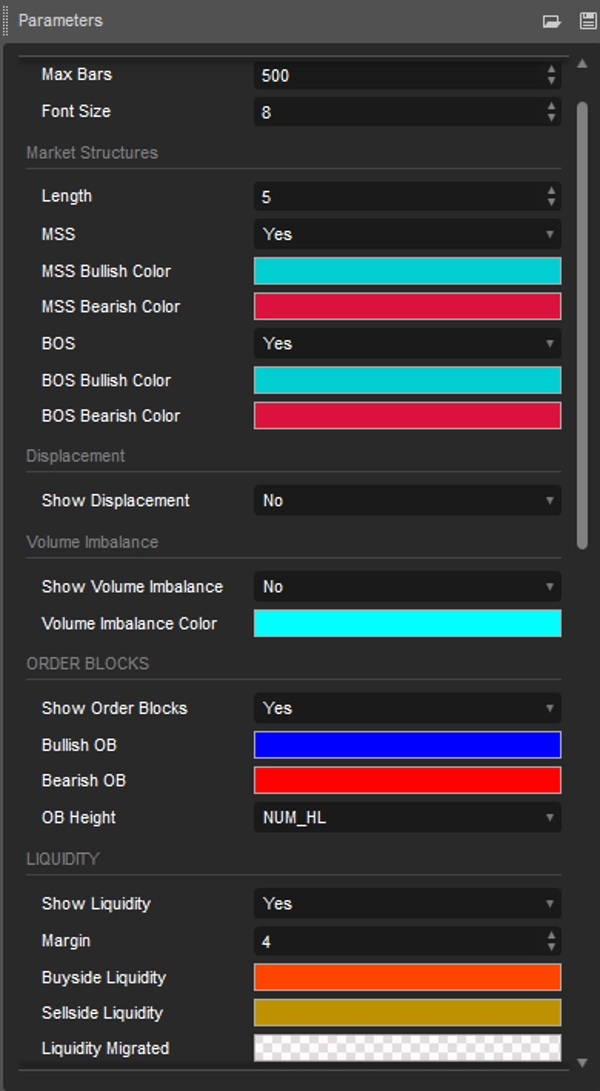
カスタマイズ可能な機能
ユーザーはデータの長さ、色、表示スタイルなどの設定を調整して、自分のトレーディングの好みに合わせることができます。
トレーダーへの利点
手動分析の時間を節約し、トレーディングの効率を向上させます。
変動の激しい市場状況で迅速かつ情報に基づいた意思決定を支援します。
初心者と経験豊富なトレーダーの両方にとって使いやすいです。
結論
Simple ICT Concepts Indicatorは単なるツールではなく、ICT戦略を効果的に実装しようとするトレーダーのための包括的なソリューションです。市場分析を強化し、正確な取引を実行するための堅牢な選択肢です。
概要
AIによる概要
The Simple ICT Concepts Indicator is a technical analysis tool designed to assist traders in applying the Inner Circle Trader (ICT) methodology. It identifies key market zones including liquidity levels, support and resistance, and market structure to support price action and smart money concept trading. The indicator labels market structure shifts (MSS) and breaks of structure (BOS) based on swing point breaks, helping users determine current market trends. It detects displacements characterized by successive candles with strong directional sentiment, volume imbalances where candle bodies leave gaps, and order blocks representing institutional buy or sell zones. The tool highlights buy-side and sell-side liquidity levels, indicating where stop-loss and limit orders cluster. It also identifies fair value gaps (FVG), implied fair value gaps (IFVG), balanced price ranges, and new week/day opening gaps (NWOG/NDOG). Users can customize settings such as data length, colors, and display styles to fit their trading preferences. The indicator aims to save time on manual analysis and facilitate quick, informed decisions in volatile markets. It is suitable for both beginners and experienced traders seeking to implement ICT strategies effectively across markets including Forex, cryptocurrencies, and indices like BTCUSD, XAUUSD, and NAS100.
インジケーターのプロフィール
カスタマーレビュー
4.0
レビュー: 1
5 | 0 % | |
4 | 100 % | |
3 | 0 % | |
2 | 0 % | |
1 | 0 % |
カスタマーレビュー
December 27, 2025
The signal still needs a chart check, no surprise there. One green trade proves nothing.
ディスカッション
よくあるご質問
BTCUSD
Forex
Signal
Fair Value Gap
Crypto
XAUUSD
NAS100
cTrader Storeで入手可能な取引ボット、インジケーター、プラグインなどの商品は、第三者の開発者が提供するものであり、情報と技術の取得のみを目的としてご利用いただけます。cTrader Storeはブローカーではなく、投資助言や個人的な推奨を行うことも、将来のパフォーマンスを保証することもありません。
この作成者の他の商品


価格
38
販売
2.33K
無料インストール