
Descripción
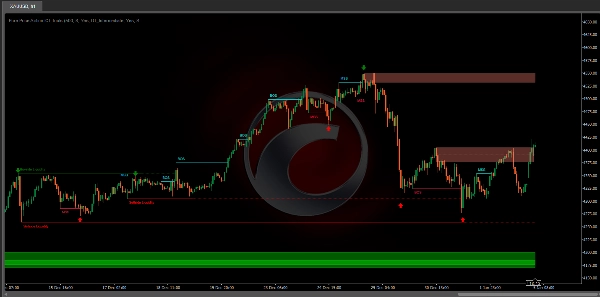
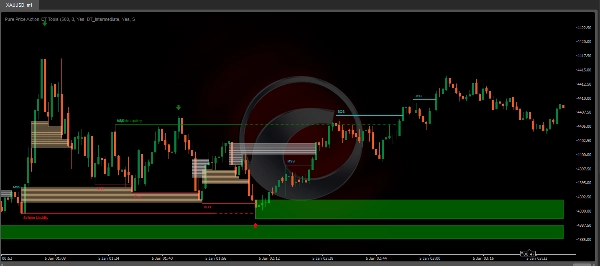
El indicador Pure Price Action ICT Tools está diseñado para un análisis puro de la acción del precio, identificando automáticamente estructuras de mercado en tiempo real, niveles de liquidez, bloques de órdenes y bloques de ruptura, y vacíos de liquidez.
Su característica única radica en su dependencia exclusiva de los patrones de precio, sin estar limitado por ninguna entrada definida por el usuario, asegurando un análisis robusto y objetivo de la dinámica del mercado.
Características clave
- Estructuras de mercado
Un Cambio de Estructura de Mercado, también conocido como Cambio de Carácter (CHoCH), es un evento crucial en el análisis de la acción del precio que indica un posible cambio en el sentimiento o dirección del mercado. Un MSS ocurre cuando el precio revierte desde una tendencia establecida, señalando que la tendencia predominante puede estar perdiendo impulso y que podría estar en marcha una reversión. Este cambio se identifica a menudo por patrones técnicos clave, como un mínimo más alto en una tendencia bajista o un máximo más bajo en una tendencia alcista, que indican un debilitamiento de la fuerza de la tendencia actual.
Una Ruptura de Estructura típicamente indica la continuación de la tendencia actual del mercado. Este evento ocurre cuando el precio se mueve decisivamente más allá de un máximo o mínimo anterior, confirmando la fuerza de la tendencia predominante. En una tendencia alcista, un BOS se marca cuando el precio rompe por encima de un máximo previo, mientras que en una tendencia bajista, se identifica cuando el precio rompe por debajo de un mínimo previo.
Aunque un Cambio de Estructura de Mercado (MSS) puede indicar una posible reversión de tendencia y una Ruptura de Estructura (BOS) a menudo confirma la continuación de la tendencia, no aseguran una reversión o continuación completa. Los niveles MSS y BOS también pueden funcionar como zonas de liquidez o áreas de consolidación de precios en lugar de señalar definitivamente un cambio en la dirección del mercado. Los traders deben abordar estas señales con precaución y validarlas con factores adicionales antes de tomar decisiones de trading. Para más detalles sobre otros componentes de la herramienta, consulte las secciones siguientes.
- Bloques de órdenes y de ruptura
Los bloques de órdenes y de ruptura son conceptos clave en el análisis de la acción del precio que ayudan a los traders a identificar niveles significativos en la estructura del mercado.
Los bloques de órdenes son zonas de precio específicas donde ha ocurrido una actividad significativa de compra o venta. Estas zonas a menudo representan las acciones de grandes traders institucionales o creadores de mercado, que ejecutan órdenes sustanciales que impactan el mercado.
Los bloques de ruptura son zonas de precio específicas donde ocurre una fuerte reversión, causando una ruptura en la estructura de mercado predominante. Estos bloques indican áreas donde el precio encontró una resistencia o soporte significativo, llevando a una reversión.
En resumen, la liquidez del lado comprador y vendedor proporciona información crucial sobre la dinámica de la demanda y oferta del mercado, ayudando a los traders a tomar decisiones informadas basadas en la disponibilidad de órdenes en diferentes niveles de precio.
- Liquidez del lado comprador y vendedor
Las zonas de liquidez tanto del lado comprador como del lado vendedor son críticas para identificar posibles puntos de inflexión en el mercado. Estas zonas son donde se concentra un interés significativo de compra o venta, influyendo en los movimientos futuros del precio.
En resumen, la liquidez del lado comprador y vendedor proporciona información crucial sobre la dinámica de la demanda y oferta del mercado, ayudando a los traders a tomar decisiones informadas basadas en la disponibilidad de órdenes en diferentes niveles de precio.
- Vacíos de liquidez
Los vacíos de liquidez son brechas o áreas en un gráfico de precios donde hay una falta de actividad comercial. Estos vacíos representan zonas con órdenes de compra o venta mínimas o inexistentes, lo que a menudo resulta en movimientos bruscos de precio cuando el mercado entra en estas áreas.
En resumen, los vacíos de liquidez son áreas cruciales en un gráfico de precios caracterizadas por la falta de actividad comercial. Estos vacíos pueden conducir a movimientos rápidos del precio y a una mayor volatilidad, por lo que son consideraciones esenciales para los traders en sus procesos de análisis y toma de decisiones.
- Puntos de giro
Los puntos de reversión de precio se conocen comúnmente como puntos de giro. Los traders suelen analizar los puntos de giro históricos para discernir tendencias del mercado y localizar posibles puntos de entrada y salida de operaciones.
Tenga en cuenta que en este script estos están sujetos a retro-pintado, es decir, no se localizan donde son detectados.
La detección de puntos de giro y la característica única de este script se basan exclusivamente en la acción del precio, eliminando la necesidad de configuraciones numéricas definidas por el usuario. El proceso comienza con la detección de puntos de giro a corto plazo:
- Máximo de giro a corto plazo (STH): Identificado como un pico de precio rodeado por máximos más bajos a ambos lados.
- Mínimo de giro a corto plazo (STL): Reconocido como un valle de precio rodeado por mínimos más altos a ambos lados.
Los puntos de giro a medio y largo plazo se detectan usando el mismo enfoque pero con una ligera modificación. En lugar de analizar directamente las velas de precio, se utilizan los puntos de giro a corto plazo previamente detectados. Para los puntos de giro a medio plazo, se analizan los puntos de giro a corto plazo, mientras que para los puntos de giro a largo plazo, se usan los de medio plazo.
Este método asegura un análisis robusto y objetivo de la dinámica del mercado, ofreciendo a los traders información confiable sobre las estructuras del mercado. Los puntos de giro detectados sirven como base para identificar estructuras de mercado, niveles de liquidez del lado comprador/vendedor, y bloques de órdenes y de ruptura presentados con esta herramienta.
En resumen, los puntos de giro son elementos esenciales en el análisis técnico, ayudando a los traders a identificar tendencias, niveles de soporte y resistencia, y puntos óptimos de entrada y salida. Entender los puntos de giro permite a los traders tomar decisiones informadas basadas en los movimientos naturales del precio en el mercado.
Configuraciones
- Estructuras de mercado
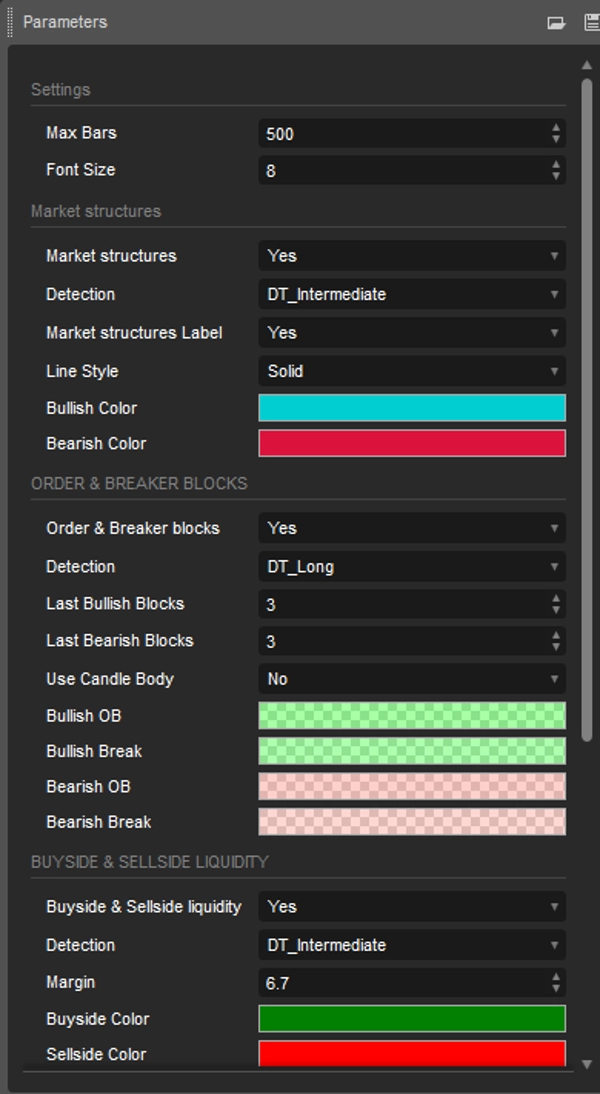
Estructuras de mercado: Alterna la visibilidad de las estructuras de mercado, tanto cambios como rupturas.
Detección: Una opción que permite a los usuarios detectar estructuras de mercado basadas en la importancia de los niveles de giro, incluyendo corto, medio y largo plazo.
Etiquetas de estructura de mercado: Controla la visibilidad de las etiquetas que resaltan el tipo de estructura de mercado.
Estilo de línea: Personaliza el estilo de las líneas que representan la estructura de mercado.
- Bloques de órdenes y de ruptura
Bloques de órdenes y de ruptura: Alterna la visibilidad de los bloques de órdenes y de ruptura.
Detección: Una opción que permite a los usuarios detectar bloques de órdenes y de ruptura basados en la importancia de los niveles de giro, incluyendo corto, medio y largo plazo.
Últimos bloques alcistas: Número de los bloques de órdenes/ruptura alcistas más recientes para mostrar en el gráfico.
Últimos bloques bajistas: Número de los bloques de órdenes/ruptura bajistas más recientes para mostrar en el gráfico.
Usar cuerpo de vela: Permite a los usuarios usar los cuerpos de las velas como áreas de bloques de órdenes en lugar del rango completo de la vela.
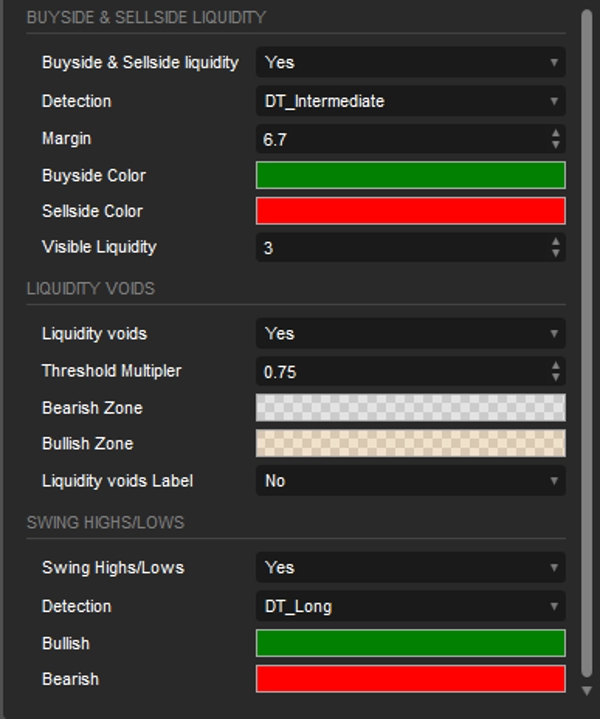
- Liquidez del lado comprador y vendedor
Liquidez del lado comprador y vendedor: Alterna la visibilidad de los niveles de liquidez del lado comprador y vendedor.
Detección: Una opción que permite a los usuarios detectar liquidez del lado comprador y vendedor basada en la importancia de los niveles de giro, incluyendo corto, medio y largo plazo.
Margen: Establece el margen/sensibilidad para la detección de un nivel de liquidez.
Liquidez visible: Controla la cantidad de niveles/zonas de liquidez que se visualizarán.
- Vacíos de liquidez
Vacíos de liquidez: Habilita la visualización de vacíos de liquidez tanto alcistas como bajistas.
Multiplicador de umbral: Define el multiplicador para el umbral, que está codificado para el rango ATR de 200 períodos.
Etiqueta: Habilita la visualización de una etiqueta que indica vacíos de liquidez.
- Puntos de giro
Máximos/Mínimos de giro: Alterna la visibilidad de los niveles de giro.
Detección: Una opción que permite a los usuarios detectar niveles de giro basados en la importancia de los niveles de giro, incluyendo corto, medio y largo plazo.
Resumen
Key functionalities include:
- Market Structures: Detects Market Structure Shifts (potential trend reversals) and Breaks of Structure (trend continuations) based on price patterns.
- Order & Breaker Blocks: Highlights significant price zones where institutional buying/selling or strong reversals occur.
- Buy-side & Sell-side Liquidity: Identifies zones of concentrated buying or selling interest that may influence price movements.
- Liquidity Voids: Marks price chart gaps with minimal trading activity, often leading to sharp price moves.
- Swing Points: Detects short-, intermediate-, and long-term reversal points to aid in trend analysis and trade decision-making.
The tool offers customizable settings to toggle visibility and detection sensitivity for each feature, including options to adjust detection based on swing level significance and display preferences. It supports analysis across various markets such as Forex, Crypto (e.g., BTCUSD), and indices (e.g., NAS100, XAUUSD). The indicator provides an objective framework for analyzing market dynamics based solely on price action patterns.
Valoraciones de clientes
5 | 67 % | |
4 | 0 % | |
3 | 33 % | |
2 | 0 % | |
1 | 0 % |


