
Descripción
Indicador de Ruptura de Volatilidad - Motor de Volatilidad Hawkes
Este indicador está diseñado para proporcionar contexto, no acciones comerciales inmediatas. El componente de volatilidad te ayuda a saber cuándo las condiciones del mercado están cambiando: los períodos de baja volatilidad suelen preceder grandes movimientos, y los períodos de alta volatilidad eventualmente se agotan. El componente EWMA te mantiene orientado con la tendencia en desarrollo y destaca cuando el precio se aleja de ella.
Combina estas dos perspectivas - régimen de volatilidad y contexto de tendencia - con tu propia metodología y juicio comercial. El indicador te muestra el entorno - tú decides qué hacer en él.
Versión 2.0
Abierto para futuras actualizaciones
-----------------------------------------------------------------------------------------------------------------------------------------------------------------------
Resumen
-----------------------------------------------------------------------------------------------------------------------------------------------------------------------
Este indicador combina dos componentes distintos para ayudar a los traders a identificar regímenes de volatilidad y condiciones de tendencia simultáneamente.
El primer componente utiliza un Proceso Hawkes para detectar cambios en la volatilidad del mercado. A diferencia de los indicadores tradicionales de volatilidad, no predice la dirección, simplemente señala cuando el mercado está pasando de una compresión tranquila a una volatilidad activa, o viceversa. Piénsalo como un detector de estado de volatilidad: te dice cuándo las cosas se están calentando o enfriando, pero no hacia dónde se moverá el precio.
El segundo componente añade un sistema dual EWMA (Media Móvil Exponencialmente Ponderada) que se superpone en tu gráfico de precios. Esto te da contexto de tendencia usando un cruce de medias móviles rápida y lenta, con una capa adicional de coloración de velas para mostrar cuando el precio se desvía de la tendencia.
-----------------------------------------------------------------------------------------------------------------------------------------------------------------------
Cómo funciona
-----------------------------------------------------------------------------------------------------------------------------------------------------------------------
Detección de Volatilidad: El indicador utiliza el estimador de Volatilidad High-Low de Parkinson, un método más eficiente que el ATR estándar porque usa el rango completo de la barra. Esta volatilidad normalizada se alimenta en un cálculo del Proceso Hawkes, que luego se compara con umbrales dinámicos basados en cuantiles.
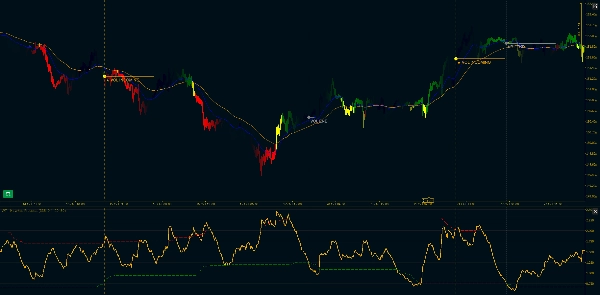
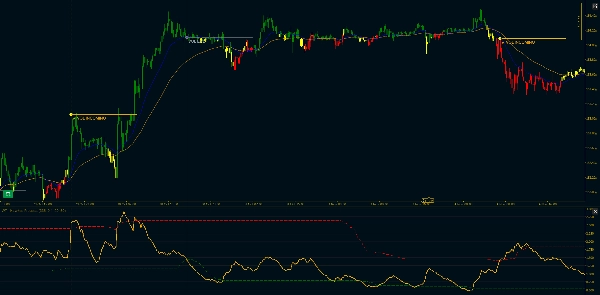
Cuando la volatilidad supera el umbral superior después de un período de compresión, obtienes una señal "VOL INCOMING". Cuando cae por debajo del umbral inferior, ves "VOL END". Estas no son señales de entrada, son cambios de régimen de volatilidad. El mercado está despertando o yéndose a dormir.
Contexto de Tendencia: Dos medias móviles exponencialmente ponderadas (Rápida y Lenta) aparecen en tu gráfico principal. La MA Rápida es azul, la MA Lenta es naranja. Cuando la Rápida está por encima de la Lenta, la tendencia es alcista. Cuando la Rápida está por debajo de la Lenta, la tendencia es bajista.
El Filtro de Divergencia: Aquí es donde se pone interesante. A veces el precio se aleja significativamente de la tendencia. Cuando toda la vela (apertura, máximo, mínimo, cierre) está por debajo de la MA Rápida durante una tendencia alcista, o por encima durante una bajista, la barra se vuelve amarilla. Este es un filtro estricto: si incluso la mecha toca la MA Rápida, mantiene el color normal de la tendencia.
Las barras amarillas suelen aparecer en retrocesos o puntos de agotamiento, pero recuerda: no te dicen qué viene después, solo que el precio se ha separado temporalmente de la línea de tendencia.
-----------------------------------------------------------------------------------------------------------------------------------------------------------------------
Características Clave
-----------------------------------------------------------------------------------------------------------------------------------------------------------------------
Componente de Volatilidad:
- Normalización de Volatilidad High-Low de Parkinson (más eficiente que el método ATR estándar)
- Cálculo del Proceso Hawkes con decaimiento ajustable (parámetro Kappa)
- Umbrales dinámicos basados en cuantiles (percentiles personalizables)
- Marcadores visuales: "VOL INCOMING" en rupturas de volatilidad, "VOL END" en compresiones
- Filtrado de continuación: solo se marca la primera ruptura, no cada pico
- Líneas de tendencia horizontales opcionales y marcadores verticales
Componente de Tendencia EWMA:
- Cálculo EWMA compatible con Pandas (fórmula adjust=True)
- Líneas MA Rápida y Lenta mostradas en el gráfico principal de precios
- Longitudes de span personalizables (por defecto: 20/50)
- Soporte para períodos mínimos (suprime salida hasta tener datos suficientes)
- Opción de ignorar NA para manejar huecos
- Sistema de velas de tres colores: Verde (tendencia alcista), Rojo (tendencia bajista), Amarillo (divergencia)
Opciones de Personalización:
- Período de Parkinson (retroceso para cálculo de volatilidad)
- Kappa de Hawkes (tasa de decaimiento, afecta sensibilidad)
- Período de retroceso para cuantiles
- Umbrales de Volatilidad Baja y Alta (percentiles)
- Interruptor de anualización y longitud de segmento
- Span Rápido y Lento para medias móviles
- Colores para alcista, bajista y divergencia
- Longitud de extensión de línea de tendencia
- Mostrar/ocultar marcadores verticales
----------------------------------------------------------------------------------------------------------------------------------------------------------------------------
Nota Técnica: El componente del Proceso Hawkes utiliza un cálculo exponencial recursivo optimizado para uso en tiempo real. La implementación EWMA coincide con el comportamiento de Pandas para consistencia con backtesting basado en Python. Ambos componentes calculan solo en barras cerradas para evitar repintados.
Resumen
Valoraciones de clientes
5 | 100 % | |
4 | 0 % | |
3 | 0 % | |
2 | 0 % | |
1 | 0 % |


