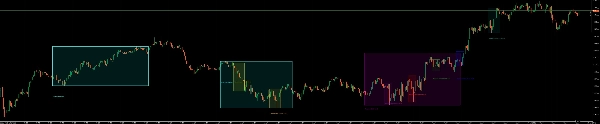
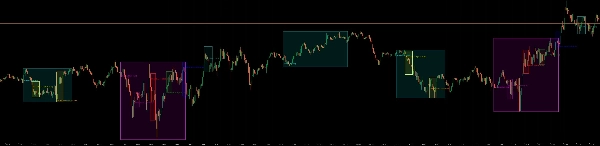
ICT Killzones & Macros
Logotipo de "ICT Killzones & Macros"
21/08/2025
Desktop
Since 22/06/2025
Ventas
12
Free installs
6

This advanced cTrader indicator plots key market session zones based on ICT (Inner Circle Trader) concepts, fully aligned.

  • 🔹 Asia, London, and New York Killzone Sessions
  • 🔹 Macro Sessions: London and New York AM/PM micro windows
  • 🔹 Smart Labels with offset and styling

Ideal for Smart Money Traders and ICT-based price action strategies, this tool helps identify high-probability trade setups by visualizing institutional timing and confluence zones.


My Other Products


Más de este autor
Tiny_Aim_Trainer
trading stress-relief “mini-game”
Indicador
NAS100
XAUUSD
Commodities
+10
MARKET_STRUCTURE BOS_CHoCH
MarketStructurePro – Smart BOS/CHoCH
Retro_Shooting_Game
trading stress-relief “mini-game”
Indicador
Indices
Commodities
Forex
Institutional FVG Zones MTF with Confluence
Professional Fair Value Gaps with multitimeframe spot on
Market_Session_Forex
Market Sessions
Indicador
NAS100
Indices
XAUUSD
+4
BSL_SSL_Liqudity
Buy-Side & Sell-Side Liquidity (BSL/SSL) Indicator
Indicador
VWAP
Breakout
Scalping
VWAP & Sessions & D,W,M HLO Levels
Killzone Session With VWAP – Precision Meets Price Action
Multi_TF Candlestick Chart Overlay
Perfect for traders who demand a clear overview of multiple timeframes at a glance.
TDI_Pro
Traders Dynamic Index (TDI) — Divergence Edition
Indicador
NAS100
Indices
Breakout
+6
All-in-One Session Levels Suite
Institutional Session Levels Pro OHLC,Prev(D,W,M OHLC)
VWAP_MTF
📊 VWAP with MTF & Dynamic Deviation Bands
Indicador
NAS100
Indices
Prop
+6
ICT_SMC_ToolKit
institutional-level market analysis
Indicador
NAS100
Indices
XAUUSD
+7
Fair Value Gaps_FVG_MTF
Multi-TF FVG + Smart Fibonacci
Puede interesarle
Vishal Volume Profile v2.0
Volume Profile plots traded volume at each price level, highlighting high activity zones of precise support & resistance
[Hamster-Coder] Pivot Points MTF
[Hamster-Coder] Pivot Points (Multi Time Frame)
Indicador
RSI
Breakout
XAUUSD
+6
Fair Value Gap Sessions
identify and highlight temporary market inefficiencies known as "fair value gaps" 🚨 within specific trading Sessions.
OHLC PRO by LudwigICT
OHLC PRO – Advanced Session & Market Structure Tool
Indicador
Indices
Stocks
Commodities
+2
SymbolTFOverlay
The SymbolTFOverlay display the current symbol and timeframe as a semi-transparent text overlay on the chart.
Indicador
Stocks
Forex
Crypto
+1
Market Structure SNR + Auto Bias
Market Structure Indicator – Your Trading Map in a Noisy Market. No more Panicking Which one, Where, Why and How.
E7 Harmonic Structures Basic
E7 Harmonic Structures Basic.
Repiptor RSI Amplified
RSI Amplified
Previous Day Equilibrium (Premium & Discount)
Plots the equilibrium price levels based on previous daily highs and lows.
Indicador
NAS100
NZDUSD
XAUUSD
+15
WVAP Neural Activity Scalp-Swing-Brake_noSourceCode
Pro trading dashboard: WVAP analysis + Volume Profile + Neural AI tracking + News alerts. All-in-one tool!
Candle Timer & Strength Panel Demo -
Candle Timer & Strength Panel DEMO for cTrader DEMO VERSION – 24 hours free trial! This is a DEMO version of the Candle
JMA-Like
JMA-like is a highly responsive and ultra-smooth moving average designed to replicate the behavior of the original JMA!
Indicador
RSI
Indices
RSI
RSI Pro Tool – Overbought & Oversold Made Easy
IVB 2.0
IVB 2.0 is an indicator that works on the strategy of imbalance of the maximum volatility box of indices
Market Polarity Zones
implifies market analysis by automatically identifying bullish 🚀 or bearish 🐻 phases and marking key levels where ....
IR Candle Open
IR Candle Open plots customizable opening price lines for daily, weekly, and monthly candles
Indicador
NAS100
NZDUSD
Martingale
+26
ICT Killzones
ICT Killzones plots Asian, London & New York trading sessions on your cTrader charts with clear zones & labels.
Indicador
Forex
EURUSD
EconomicForex
ECONOMIC FOREX:provides insights into inflation, nominal interest rates and real interest rates, in the line chart