
Descripción
¿Qué es un Indicador de Línea de Tendencia?
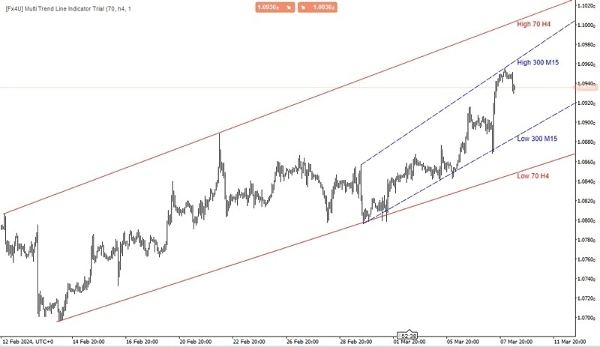
Un indicador de línea de tendencia es una herramienta de análisis técnico utilizada por traders y analistas para identificar la dirección y la fuerza de una tendencia en un mercado financiero. Se basa en trazar una línea recta que conecta dos o más puntos de precio en un gráfico. El propósito principal de una línea de tendencia es representar visualmente la dirección general del movimiento del precio durante un período específico.
Indicador de Línea de Tendencia Multitemporal
La función principal de un indicador de línea de tendencia multitemporal es proporcionar a los traders una perspectiva más amplia de las tendencias del mercado al agregar información de varios marcos temporales. Al analizar tendencias en múltiples marcos temporales, los traders pueden tomar decisiones más informadas sobre posibles puntos de entrada y salida, así como sobre la dirección general del mercado.
Este tipo de indicador generalmente permite a los traders personalizar los marcos temporales que desean analizar y trazar líneas de tendencia en consecuencia. Puede ser una herramienta valiosa para identificar niveles clave de soporte y resistencia, reversiones de tendencia y continuaciones de tendencia en diferentes marcos temporales, ayudando así a los traders a tomar decisiones comerciales más precisas.
Existen varios tipos de líneas de tendencia, incluyendo:
- Línea de Tendencia Alcista: Esta se dibuja conectando dos o más mínimos sucesivos en un gráfico de precios. Sugiere una tendencia alcista, indicando que los precios generalmente están subiendo con el tiempo.
- Línea de Tendencia Bajista: Por el contrario, una línea de tendencia bajista se dibuja conectando dos o más máximos sucesivos en un gráfico de precios. Sugiere una tendencia bajista, indicando que los precios generalmente están cayendo con el tiempo.
- Línea de Tendencia Horizontal: También conocidas como líneas de soporte o resistencia, estas se dibujan horizontalmente para indicar áreas donde el movimiento del precio tiende a detenerse o revertirse.
Los traders a menudo usan las líneas de tendencia junto con otros indicadores técnicos y métodos de análisis para tomar decisiones comerciales informadas. Cuando una línea de tendencia se rompe o se viola, puede indicar un posible cambio en la dirección de la tendencia, proporcionando señales de trading para los inversores.
Mis otros productos:
https://ctrader.com/products/346
https://ctrader.com/products/336
https://ctrader.com/products/343
https://ctrader.com/products/347
https://ctrader.com/products/148
Resumen
Valoraciones de clientes
5 | 67 % | |
4 | 0 % | |
3 | 33 % | |
2 | 0 % | |
1 | 0 % |
![Logotipo de "[Fx4U] GBPUSD - Price Action"](https://cdn.ctrader.com/image/webp/d80b34fc-da3c-4f01-a321-456450665649_26190)

![Logotipo de "[Fx4U] CADJPY - Price Action"](https://cdn.ctrader.com/image/webp/1ba81247-b6b7-4f3c-a297-fa3eb1d57fe1_26195)

![Logotipo de "[Fx4U] AUDCHF - Price Action"](https://cdn.ctrader.com/image/webp/0a22e9aa-c83b-42cd-b0b8-c1a2da593207_26148)

![Logotipo de "[Fx4U] EURAUD - Price Action"](https://cdn.ctrader.com/image/webp/baf8dde4-1ef3-4beb-8ae2-0fed8320f65d_26177)


![Logotipo de "[Stellar Strategies] Market Session Ultimate"](https://cdn.ctrader.com/image/webp/61ffd537-0125-4246-9e72-42eca1791d64_28232)


