
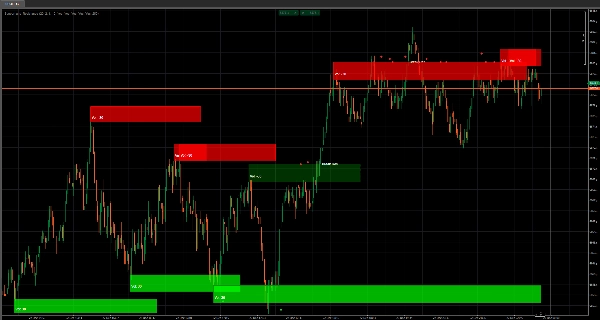
✅ Box di Supporto e Resistenza ad Alto Volume — mappa automaticamente le vere zone di “difesa / rottura”
✅ Forza della Zona Ponderata per Volume (opacità dinamica) — volume più forte = presenza della box più marcata
✅ Creazione di Zona Basata su Pivot (Lookback) — solo i livelli confermati diventano zone (meno rumore)
✅ Larghezza Adattiva della Box (basata su ATR) — le zone si adattano alla volatilità attuale, non a stime fisse
✅ Estensione Live della Box — le zone continuano a proiettarsi in avanti mentre il prezzo evolve
✅ Intelligenza di Rottura / Tenuta — rileva quando una zona tiene o si rompe e reagisce istantaneamente
✅ Segni Visivi di Evento (Diamanti) — conferme “tenuta / inversione” chiare senza complicazioni
✅ Etichette di Rottura — eventi “Break Sup / Break Res” chiari sul grafico
✅ Controllo Visivo Completo — interruttori per Box / Testo Volume / Diamanti / Etichette di Rottura
✅ Sistema di Pulizia Automatica — previene il disordine sul grafico rimuovendo automaticamente i vecchi segni di evento
✅ Controllo Massimo Box — limite rigido per mantenere le prestazioni veloci e i grafici leggibili
Supporto e Resistenza (Box ad Alto Volume) non è uno strumento S/R di base che sputa linee casuali.
Questo indicatore è costruito per mostrarti qualcosa di molto più prezioso:
Dove il prezzo ha creato reale interesse — e dove è più probabile che reagisca di nuovo.
Invece di tracciare “livelli carini,” costruisce zone di domanda e offerta ad alto volume come box direttamente sul tuo grafico, così puoi operare sulla struttura come un professionista:
identifica la zona → osserva la reazione → opera sulla tenuta o sulla rottura.
Il Vantaggio Fondamentale: Volume + Struttura, non supposizioni
Ogni box viene creato solo quando due condizioni si allineano:
- Un pivot confermato (la struttura conta)
- Un estremo di volume (l’interesse conta)
Questo significa che non riceverai spam di zone deboli.
Ricevi meno zone — ma quelle che ricevi sono le zone che contano davvero.
Forza che Puoi Vedere (Opacità = Potenza)
Qui diventa ingiusto per chi opera con S/R “alla cieca”.
L’opacità del riempimento della box scala con il volume, così sai immediatamente:
- Box tenue = interesse leggero (osserva)
- Box forte = interesse pesante (rispettala)
Nessun indicatore extra, nessuna ginnastica interpretativa — è letteralmente visibile.
Zone Adattive alla Volatilità (Larghezza ATR)
I mercati non si muovono allo stesso modo ogni giorno.
Questo indicatore adatta lo spessore della box usando una baseline ATR lunga, così le zone si espandono o si restringono con la volatilità.
Risultato:
le zone rimangono realistiche invece di essere troppo sottili per contare o così larghe da essere inutili.
Intelligenza di Tenuta vs Rottura (e Feedback Visivo Istantaneo)
Una zona è preziosa solo se puoi leggere cosa il prezzo sta facendo con essa.
Questo indicatore traccia:
- Tenute (rifiuto / rispetto)
- Rotture (accettazione attraverso la zona)
…e poi aggiorna lo stile in tempo reale:
- Le tenute mantengono la “identità supporto/resistenza” originale
- Le rotture invertono il comportamento (il supporto può diventare resistenza e viceversa)
- Lo stile della rottura può passare a tratteggiato + nuova tonalità di colore così sai subito:
“Questo livello ha appena cambiato carattere.”
Diamanti + Etichette di Rottura: Trigger di decisione chiari
Ottieni marcatori di evento semplici e ad alto segnale:
- Diamanti per evidenziare eventi di tenuta/inversione
- Etichette di rottura così non perdi mai il momento in cui un livello cede
È la differenza tra pensare che qualcosa si sia rotto… e sapere che si è rotto.
Progettato per il Trading Reale: Controllo + Grafici Puliti
Questo indicatore è stato progettato per rimanere utilizzabile dopo ore di trading:
- Vuoi solo le zone? Disattiva diamanti/etichette.
- Vuoi segnali puri? Disattiva il testo del volume.
- Vuoi prestazioni? Limita Max Boxes.
- Odi il disordine? Auto-Clean Events mantiene il grafico nitido rimuovendo automaticamente i vecchi segni.
Rimani concentrato sulla battaglia attuale — non sommerso dalla storia.
Configurazione Consigliata (Avvio Rapido)
✅ Periodo Lookback: 20 (conferma bilanciata)
✅ Lunghezza Filtro Volume: 2 (reattivo)
✅ Moltiplicatore Larghezza Box: 1.0 (neutrale)
✅ Mostra Box: ON
✅ Diamanti + Etichette di Rottura: ON (finché non impari il comportamento, poi affina)
✅ Eventi Auto-Clean: ON (mantieni pulito)
Cosa ti dà davvero questo indicatore
Una mappa visiva di dove il mercato ha mostrato le sue carte — e una lettura in tempo reale se il prezzo sta rispettando quella zona o la sta distruggendo.
Se operi su rotture, ritracciamenti, inversioni o retest:
questo diventa il tuo “overlay del campo di battaglia.”


![Logo di "[Hamster-Coder] Pivot Points MTF"](https://cdn.ctrader.com/image/webp/4c143e5a-309c-40e3-a578-f04d1e133ffa_31159)


![Logo di "[Hamster-Coder] Bollinger Bands"](https://cdn.ctrader.com/image/webp/21d8e5d6-fb11-4bac-b9ee-cd05c2b76804_30327)


