
Descrizione
✅ Identifica condizioni di ipercomprato e ipervenduto con momentum normalizzato
✅ Utilizza un prezzo centrale smussato basato su EMA per una generazione di segnali stabile
✅ Mostra doppisti istogrammi (Oo e Ll) per visualizzare la pressione del momentum
✅ Barre codificate a colori mostrano istantaneamente fasi rialziste, ribassiste o indecise
✅ Segna punti precisi di ACQUISTO e VENDITA con frecce di crossover rigorose
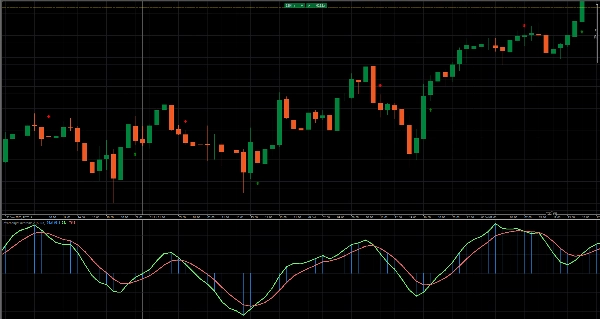
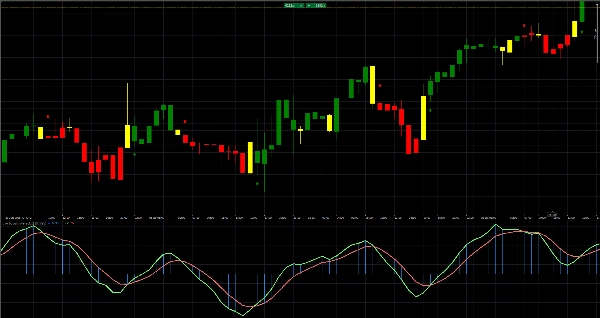
Migliora il tuo tempismo con l'Indicatore di Ipercomprato / Ipervenduto: calcola un prezzo centrale smussato (ys1) tramite EMA, normalizza il momentum attraverso la deviazione standard e traccia doppi istogrammi (Oo e Ll) insieme a linee EMA ascendenti/descendenti. Le barre codificate a colori evidenziano immediatamente spostamenti di momentum rialzisti (verde), ribassisti (rosso) o indecisi (giallo), mentre frecce di crossover rigorose segnano punti precisi di acquisto e vendita. Aggiungi questo overlay al tuo grafico per segnali chiari di ipercomprato/ipervenduto e temporizza con sicurezza i tuoi ingressi e uscite!
Disponibile anche come CBOT overbought oversold cbot cBot - cTrader Store
Riepilogo
Recensioni dei clienti
5 | 100 % | |
4 | 0 % | |
3 | 0 % | |
2 | 0 % | |
1 | 0 % |


