
Institutional Flow Radar
Indicatore
3 acquisti
Versione 1.0, Nov 2025
Windows, Mac
4.3
Recensioni: 3
Descrizione
Institutional Flow Radar – Descrizione
Concetto:
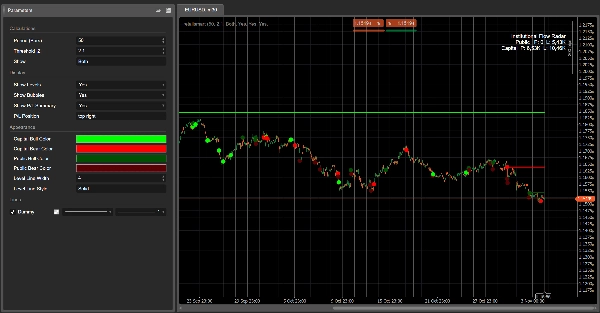
Institutional Flow Radar analizza il grafico alla ricerca di eventi di volume anomalo e li classifica in due gruppi:
- Capitale → attività attribuita a partecipanti più forti / meglio informati
- Pubblico → attività attribuita alla folla più ampia
Successivamente:
- disegna livelli orizzontali in corrispondenza di quegli eventi,
- segna gli eventi più rilevanti con bolle colorate,
- e mostra un riassunto P/L confrontando quanto volume di Capitale vs Pubblico è attualmente in profitto o perdita.
A colpo d’occhio, vedi dove un grande volume ha colpito il nastro, chi sta vincendo, e quali prezzi stanno ancora reggendo.
Come funziona (versione breve)
- Per ogni barra, l’algoritmo calcola uno Z-score del volume sulle ultime N barre (Periodo).
- Se il valore assoluto dello Z-score supera la tua Soglia |Z|, quella barra viene contrassegnata come evento di volume.
- La struttura della candela (corpo rispetto all’intervallo totale) viene utilizzata per classificare l’evento:
-
- corpo più piccolo, stoppini lunghi → Capitale (assorbimento / comportamento più complesso)
- corpo più grande, movimento direzionale → Pubblico (breakout stile folla / inseguimento)
- Un livello orizzontale viene disegnato al prezzo dell’evento e mantenuto finché il prezzo non attraversa chiaramente quel livello (mitigazione).
- Per ogni livello attivo, il Radar verifica se il prezzo corrente è:
-
- in profitto per quel lato (il prezzo si è mosso nella direzione dell’evento), oppure
- in perdita (il prezzo si è mosso contro di esso).
- La casella di riepilogo P/L aggrega i volumi di tutti i livelli attivi:
-
- Profitto Capitale vs Perdita Capitale
- Profitto Pubblico vs Perdita Pubblico
Elementi visivi
- Livelli Capitale:
-
- Eventi in salita → livello Capitale rialzista (es. verde brillante / acqua)
- Eventi in discesa → livello Capitale ribassista (es. rosso brillante)
- Livelli Pubblico:
-
- Eventi in salita → livello Pubblico rialzista (tono grigiastro)
- Eventi in discesa → livello Pubblico ribassista (grigio scuro / carbone)
- Bollicine:
-
- Cerchi sugli eventi più significativi, colorati in base a:
-
- direzione (rialzista/ribassista)
- classe (Capitale / Pubblico)
- Casella riepilogo P/L:
-
- Righe: Pubblico, Capitale
- Colonne: Profitto, Perdita
- L’intensità dello sfondo della cella aumenta con il volume corrispondente.
Etichette parametri suggerite (Inglese)
- Periodo (Barre): numero di barre usate per calcolare lo Z-score del volume.
- Soglia |Z|: valore minimo assoluto di Z-score per contrassegnare un evento.
- Mostra:
Capitale,Pubblico, oEntrambi– quale classe visualizzare. - Mostra Livelli / Mostra Bolle / Mostra Riepilogo P/L
- Colore Toro Capitale / Colore Orso Capitale
- Colore Toro Pubblico / Colore Orso Pubblico
- Larghezza Linea Media / Stile Linea Medio
Riepilogo
Riepilogo AI
Institutional Flow Radar is a trading indicator that identifies and classifies abnormal volume events on price charts into two categories: Capital (activity from stronger or more informed participants) and Public (activity from the broader crowd). It calculates a volume Z-score for each bar over a specified period and flags bars exceeding a set threshold as volume events. These events are further classified based on candle structure—smaller bodies with long wicks indicate Capital activity, while larger bodies with directional moves indicate Public activity.
The indicator visually marks these events by drawing horizontal levels at event prices, which remain until price moves decisively through them. Significant events are highlighted with colored bubbles indicating direction (bullish or bearish) and classification (Capital or Public). A P/L summary box aggregates volume at active levels, showing Capital and Public volumes currently in profit or loss.
Users can customize parameters such as the period for Z-score calculation, threshold for event detection, and visual settings including colors for bullish and bearish levels for both Capital and Public groups. This tool provides a consolidated view of where large volume occurred, which participant group is prevailing, and which price levels are holding, aiding in volume-based breakout analysis.
Profilo indicatore
Recensioni dei clienti
4.3
Recensioni: 3
5 | 33 % | |
4 | 67 % | |
3 | 0 % | |
2 | 0 % | |
1 | 0 % |
Recensioni dei clienti
November 18, 2025
The only reason it stays interesting is the trading notes stop feeling so random, and two sessions say more than one clean chart.
November 9, 2025
Discussioni
Domande frequenti
Breakout
I prodotti disponibili tramite cTrader Store, inclusi bot di trading, indicatori e plugin, sono forniti da sviluppatori terzi e resi disponibili esclusivamente a scopo informativo e di accesso tecnico. cTrader Store non è un broker e non fornisce consulenze in materia di investimento, raccomandazioni individualizzate o garanzie di risultati futuri.


![Logo di "[Hamster-Coder] Bollinger Bands"](https://cdn.ctrader.com/image/webp/21d8e5d6-fb11-4bac-b9ee-cd05c2b76804_30327)


Prezzo
42.11M
Volume negoziato
6.13M
Profitto in pip
221
Vendite
8.38K
Installazioni gratuite