
Frac Support Resistance V1
Indicatore
2 acquisti
Versione 1.0, Nov 2025
Windows, Mac
5.0
Recensioni: 1
Descrizione
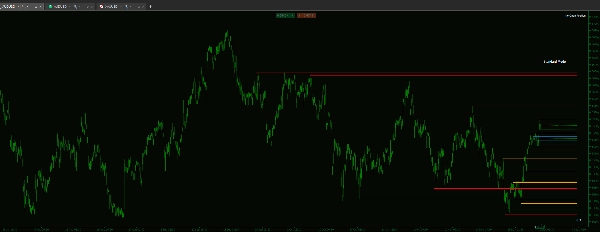
Se fai trading basandoti sulla struttura di mercato, sai che i livelli più critici sono spesso impostati su un timeframe superiore. Questo indicatore personalizzato risolve la frustrazione di identificare e monitorare manualmente tali livelli.
Questo strumento è progettato per fornire una gerarchia visiva affidabile, garantendo che tu possa vedere i confini strutturali critici e dare priorità alle zone di alto valore senza lasciare la schermata di esecuzione.
Caratteristiche principali e controllo granulare
- L'indicatore è costruito per prestazioni eccezionali e una visualizzazione pulita del grafico:
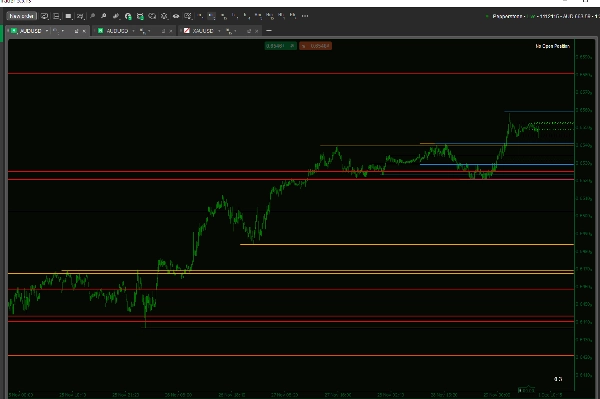
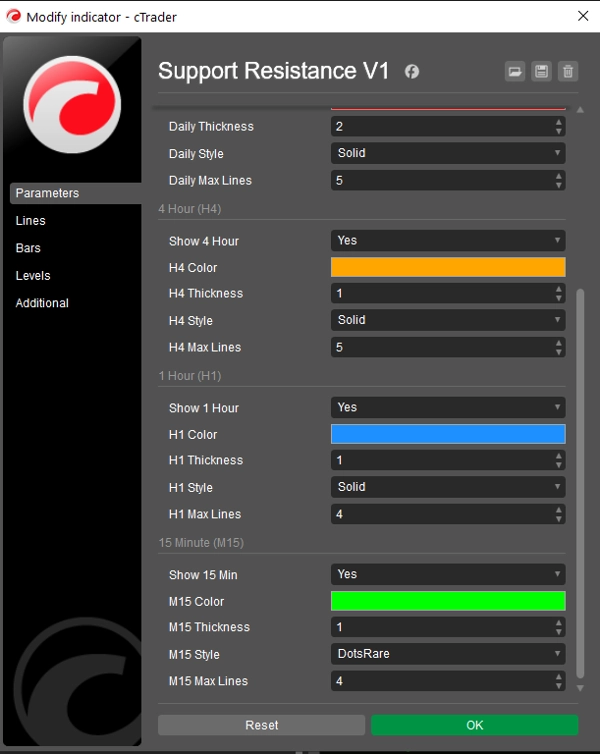
- Vera gerarchia visiva: ottieni il controllo indipendente sullo spessore, stile della linea (Solido, Tratteggiato, Puntinato) e colore per ogni singolo timeframe.
- Vantaggio: riconosci immediatamente la forza di un livello solo dal suo aspetto (ad esempio, imposta le linee D1 come Spesse/Solide per la struttura principale e le linee H1 come Sottili/Puntinate per i livelli immediati).
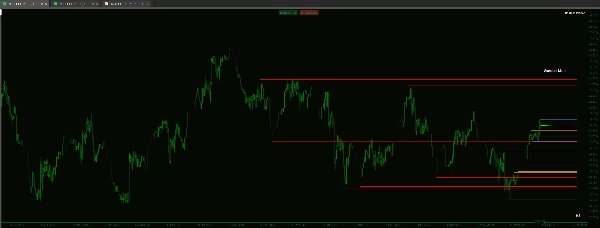
- Controllo delle prestazioni e della concentrazione: stanco di grafici ingombrati? Puoi limitare il numero massimo di linee visualizzate per ogni singolo timeframe.
- Esempio: imposta il numero massimo di linee H4 a 5 e D1 a 15 per dare priorità ai livelli recenti sui timeframe inferiori mantenendo una visione più profonda delle strutture principali.
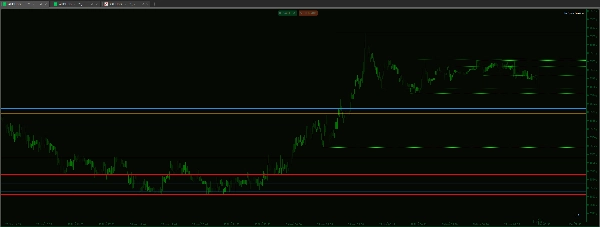
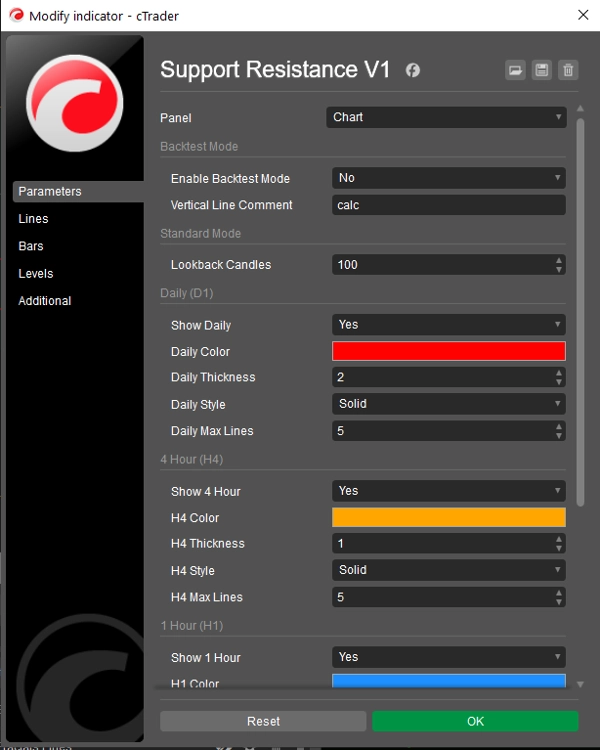
- Fondazione di codice pulito: costruito su una logica frattale affidabile, garantendo che i livelli identificati siano veri pivot di massimo/minimo utilizzati nell'analisi strutturale standard.
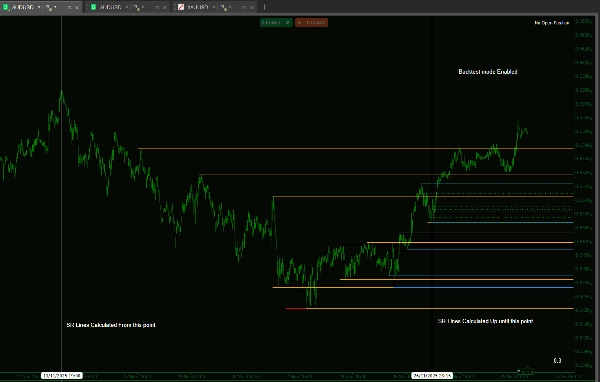
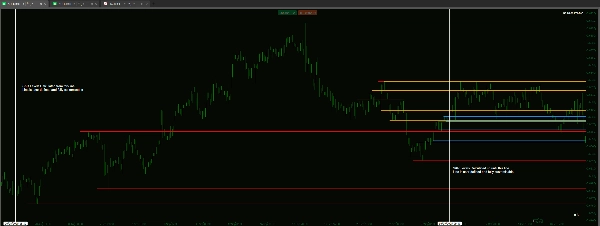
- Modalità di backtesting dedicata: include una funzione per limitare l'analisi dell'indicatore a un intervallo di tempo specifico e definito sul grafico. Questo è essenziale per un backtesting manuale accurato simulando la progressione del tempo senza bias futuri.
Riepilogo
Riepilogo AI
Frac Support Resistance V1 is a technical indicator designed to automatically calculate and display smart support and resistance lines derived from multiple timeframes: daily (D1), 4-hour (H4), hourly (H1), and 15-minute (M15). It assists traders who rely on market structure by visually highlighting critical price levels established on higher timeframes, reducing the need for manual identification.
Key features include customizable visual hierarchy, allowing independent adjustment of line thickness, style (solid, dashed, dotted), and color for each timeframe. This enables quick recognition of the relative strength of support and resistance levels. Users can also control chart clarity by setting maximum numbers of lines per timeframe to prioritize recent or major structural levels.
The indicator is based on fractal logic to identify genuine high and low pivots consistent with standard market structure analysis. It includes a dedicated backtesting mode that restricts analysis to a specified historical period, facilitating unbiased manual strategy testing by simulating real-time progression.
Frac Support Resistance V1 supports various markets including Forex, cryptocurrencies, commodities, indices, and stocks, with tags indicating compatibility with symbols like BTCUSD, EURUSD, GBPUSD, XAUUSD, NAS100, and USDJPY. The tool is suited for strategies involving breakout, scalping, smart money concepts, and grid trading.
Profilo indicatore
Recensioni dei clienti
5.0
Recensioni: 1
5 | 100 % | |
4 | 0 % | |
3 | 0 % | |
2 | 0 % | |
1 | 0 % |
Recensioni dei clienti
December 1, 2025
A small account test feels safer, and the plan becomes easier to stick with, and the chart still needs a final look.
Discussioni
Domande frequenti
BTCUSD
Forex
Signal
Breakout
Indices
EURUSD
Commodities
GBPUSD
NZDUSD
Prop
Scalping
SMC
Crypto
Grid
Stocks
AI
XAUUSD
NAS100
USDJPY
I prodotti disponibili tramite cTrader Store, inclusi bot di trading, indicatori e plugin, sono forniti da sviluppatori terzi e resi disponibili esclusivamente a scopo informativo e di accesso tecnico. cTrader Store non è un broker e non fornisce consulenze in materia di investimento, raccomandazioni individualizzate o garanzie di risultati futuri.


Prezzo
Da 14/01/2025
55
Vendite
11.5K
Installazioni gratuite