
Descripción
🧭 Cronometra tus operaciones por el reloj: Atlas revela cuándo los mercados tienden a moverse por mes, día de la semana y hora. 🧭
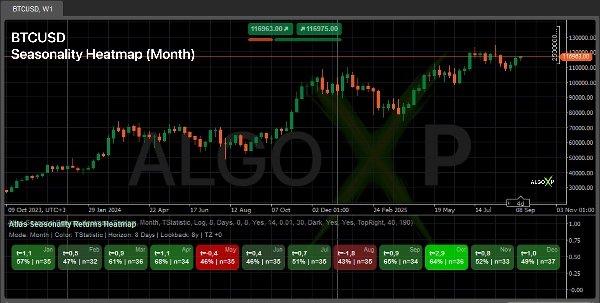
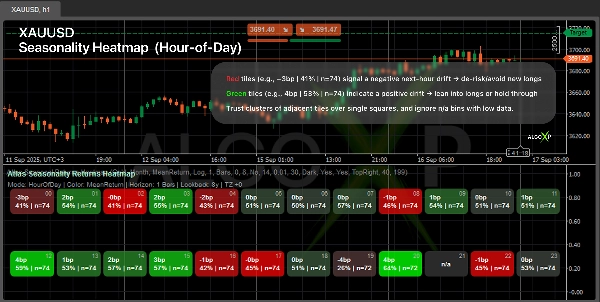
Ve cuándo tu mercado tiende a moverse — por Mes, Día de la Semana o Hora del Día.
Atlas calcula retornos futuros sobre un horizonte que elijas y pinta un mapa de calor simétrico (Bajo → Cero → Alto). Cada casilla muestra una métrica (Media, T-stat, o Sharpe) más hit% | n. Úsalo para cronometra entradas/salidas, planificar sesiones y filtrar riesgos.
🎯 Por qué los traders lo usan
- Detecta ventanas verdes para entrar y ventanas rojas para mantenerse al margen.
- Planifica sesiones alrededor de horas/días estadísticamente favorables.
- Agrega una capa limpia de “cuándo” a estrategias discrecionales y sistemáticas.
⚙️ Cómo funciona
- Anticipa un intervalo que elijas y resume cómo tiende a comportarse el precio en ese intervalo.
- Agrupa los resultados en segmentos de tiempo (Mes / Día de la semana / Hora) y respeta tu zona horaria.
- Aplica protección contra valores atípicos y una puntuación robusta de fuerza por segmento (más tamaño de muestra).
- Pinta un mapa de calor equilibrado alrededor de lo neutral usando tus colores Alto / Cero / Bajo.
👥 Para quién es
- Traders discrecionales — mejor cronometraje y tamaño por sesión.
- Constructores de sistemas y bots — una capa de filtro de tiempo / dimensionamiento temporal para estrategias.
- Traders de criptomonedas e índices — patrones de comportamiento rápidos a través de días/horas.
- Principiantes — lectura simple: más verde = sesgo más positivo sobre tu horizonte elegido.
🚀 Inicio rápido
- Elige Preajuste de activo (Forex/Cripto/Índice/Oro).
- Configura el Horizonte (p. ej., 1 Hora para HOD, 1 Día para DOW/Mes).
- Ajusta Periodo de observación, Mínimo de observaciones y colores.
- Lee los grupos (varias casillas verdes/rojas adyacentes) para las señales más fuertes.
ℹ️ La estacionalidad no garantiza resultados futuros. Es un patrón estadístico que depende del período y la metodología. Usa el indicador como contexto para tus reglas de entrada/salida y gestión de riesgos, prueba la robustez en múltiples ventanas de observación y evita confiar en segmentos con bajo n (tamaño de muestra).
Resumen
The indicator supports multiple asset presets including Forex, Crypto, Indices, and Commodities, and respects the user’s timezone. It applies outlier protection and calculates a robust strength score per time bucket to ensure reliable insights. Users can customize parameters like lookback period, minimum observations, and color schemes.
Atlas is suitable for discretionary traders seeking better timing and sizing, system and bot builders needing a time-based filter or sizing layer, crypto and index traders analyzing behavioral patterns, and beginners looking for a straightforward indication of positive or negative market bias. It provides a statistical context for entry/exit decisions and risk management but should be used alongside other analysis tools.
Valoraciones de clientes
5 | 50 % | |
4 | 50 % | |
3 | 0 % | |
2 | 0 % | |
1 | 0 % |


