
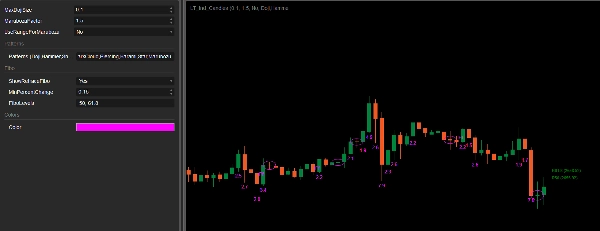
LT_Ind_Candles
Gösterge
4 satın almalar
Sürüm 1.0, Sep 2024
Windows, Mac
4.0
Değerlendirmeler: 1
Açıklama
Not: Yalnızca cTrader Windows üzerinde test edilmiştir.
Tek Mum Desenleri:
- Doji
- Çekiç
- Shooting Star
2 Mum Desenleri:
- Engulf
- DarkCloud
- Piercing
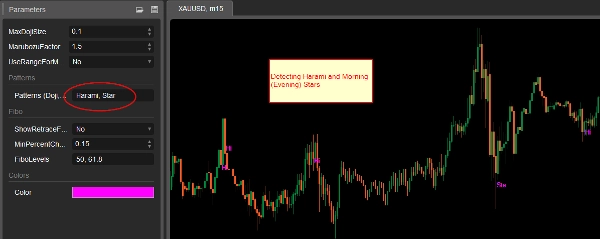
- Harami
3 Mum Desenleri:
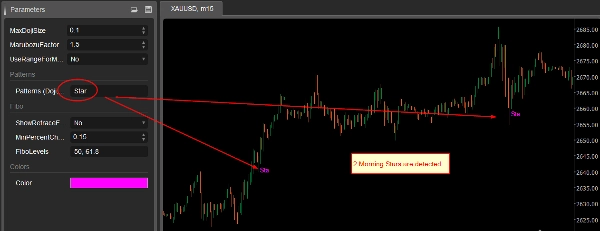
- Morning Stars
- Eveving Stars
Marubozu:
Seçiliyse, büyük gövde mumların boyutu not edilir. Boyut için ayar açıklamalarını okuyun.
Ayarlar:
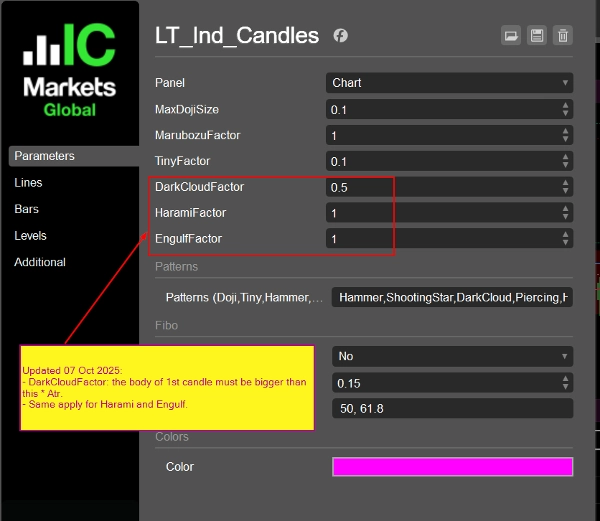
(07 Ekim 2025 Güncellemesi:
- MedianBarBody yerine Atr (14 periyot, basit hareketli ortalama) kullanın
- DarkCloud (ve Piercing), Harami, Engulf faktörleri için ayarlar eklendi
)
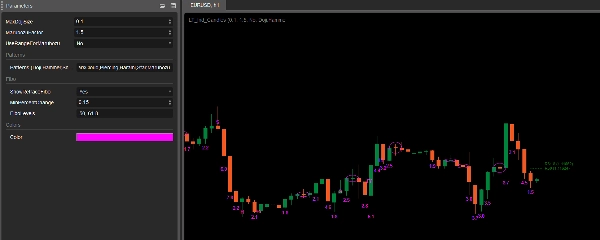
- MaxDojiSize: Bir Doji olarak kabul etmek için Bar Gövdesi ile Bar Aralığı arasındaki maksimum oran (varsayılan 0.1).
- Marubozu Faktörü: Mevcut barın BarGövdesi, büyük mum (Marubozu) olarak kabul edilmek için MarubozuFaktör * Atr'den büyük olmalıdır. Burada fitil önemli değildir.
- Marubozu için Aralık Kullan: Marubozu kontrolü yaparken BarGövdesi (Açılış - Kapanış) yerine BarAralığı (Yüksek - Düşük) kullanın.MathAbs().
- Desenler: Tespit etmek istediğiniz desenleri virgülle ayırarak yazın. Kabul edilen değerler: Doji,Çekiç,ShootingStar,Engulf,DarkCloud,Piercing,Harami,Star,Marubozu. "Star" seçilirse, hem Morning Stars hem de Evening Stars tespit edilir.
- Retrace Fibo Göster: Riskinizi kontrol etmenize yardımcı olacak yardımcı Fibo seviyeleri. Ardışık 2 Yüksek Yüksek ve Yüksek Düşük mum olduğunda, bu 2 mumdan hesaplanan belirtilen Fibo seviyeleri çizilir. Fiyat seviyelere ulaşana kadar girişinizi tutabilirsiniz. Seviyeler ayarlanabilir. Karşı taraf da aynıdır (Düşük Yüksek ve Düşük Düşük).
- Min Yüzde Değişim: Fibo seviyeleri için kullanılan 2 mumun fiyat değişimi bu yüzdeyi aşmalıdır.
- Fibo Seviyeleri: Seviyelerinizi virgülle ayırarak yazın.
- Renk: Mum notasyonunun rengi.
Özet
Gösterge profili
Müşteri değerlendirmeleri
4.0
Değerlendirmeler: 1
5 | 0 % | |
4 | 100 % | |
3 | 0 % | |
2 | 0 % | |
1 | 0 % |
Tartışma
SSS
Forex
Signal
Indices
Commodities
Crypto
Stocks
ATR
cTrader Store üzerinden erişilebilen işlem botları, göstergeler ve eklentiler gibi ürünler, üçüncü taraf sağlayıcılar tarafından sağlanır ve yalnızca bilgilendirme ve teknik erişim amaçlarıyla sunulur. cTrader Store bir broker değildir ve yatırım tavsiyesi, kişisel öneriler vermez veya gelecekteki performansı garanti etmez.


Fiyat
Başlangıç 25/09/2024
35
Satışlar