
Penerangan
Nota: Diuji hanya pada cTrader Windows.
LT_Ind_Pivot adalah penunjuk Titik Pivot yang kuat dan boleh disesuaikan untuk cTrader yang membantu memvisualisasikan tahap pasaran utama dan struktur sesi merentasi pelbagai jangka masa.
Ia secara automatik mengira dan melakar Pivot (P), Sokongan (S1–S5), Rintangan (R1–R5), dan CPR (TC/BC) berdasarkan jangka masa Anchor pilihan anda — dari H1, H4, H8, H12, D1, W1, hingga Month1.
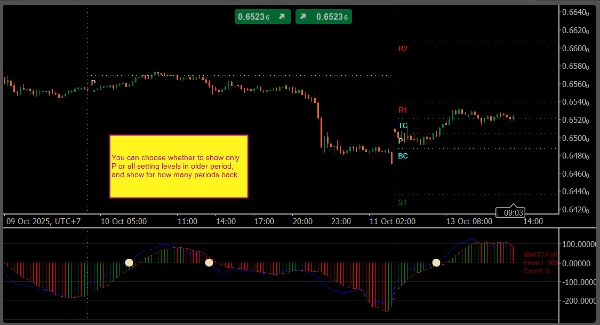
Penunjuk ini juga melukis garis pemisah menegak untuk setiap tempoh anchor, kedua-duanya pada graf utama dan panel penunjuk, memudahkan untuk membezakan sempadan sesi atau tempoh.
Anda boleh menentukan dengan tepat tahap mana yang hendak dipaparkan menggunakan notasi fleksibel seperti:
P, S1, R1– tahap standardPS1,S1S2,R1R2, dan lain-lain – tahap tengah antara pivot dan sokongan/rintangan utamaTC,BC– Julat Pivot Pusat (CPR)
Kawalan paparan membolehkan anda menetapkan berapa banyak pivot sejarah yang hendak dikekalkan kelihatan, sama ada untuk memaparkan label teks/harga, dan bagaimana untuk mewarnakan atau menggayakan setiap tahap.
Ciri Utama
- Anchor pivot: H1, H4, H8, H12, D1, W1, Month1
- Sintaks tahap tersuai:
P, Sx, Rx, PS1, S1S2, R1R2, TC, BC - Pemisah tempoh menegak pada graf dan panel penunjuk
- Pilihan untuk memaparkan teks, harga, dan tahap pivot lama
- Penyesuaian penuh warna dan gaya garis
- Ringan dan sesuai untuk dagangan langsung
Tetapan Lalai
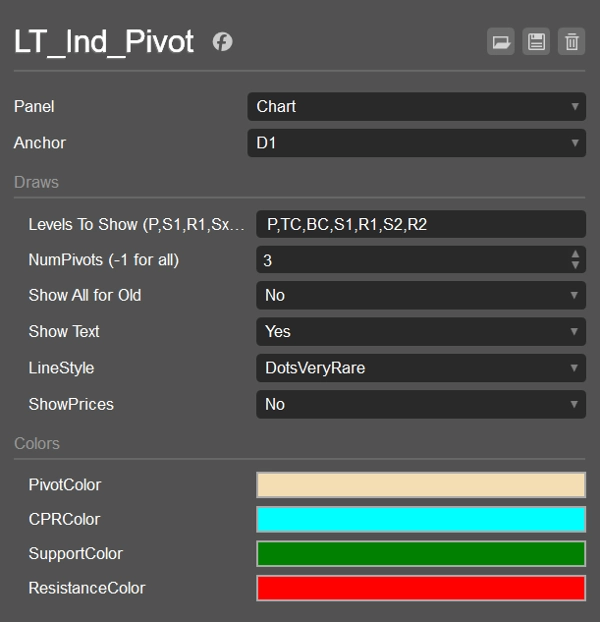
- Anchor: D1
- Paparkan Tahap:
P,S1,R1 - NumPivotsBack: 1
- ShowAllForOldPivots: palsu
- Paparkan Teks: benar
- Paparkan Harga: palsu
- Gaya Garis: Pepejal
- Warna: Pivot = Gandum, CPR = Sian, Sokongan = Hijau, Rintangan = Merah
Kes Penggunaan
- Tandakan zon sokongan/rintangan intrahari dan ayunan
- Jejaki CPR dan tahap tengah untuk persediaan pecahan atau pembalikan purata
- Gunakan pemisah tempoh untuk menganalisis struktur sesi demi sesi
- Gabungkan dengan penunjuk VWAP atau Swing untuk konfluens yang lebih tinggi
Ringkasan
Ulasan pelanggan
5 | 0 % | |
4 | 100 % | |
3 | 0 % | |
2 | 0 % | |
1 | 0 % |


