

LT_Ind_SRZones
Gösterge
5 satın almalar
Sürüm 1.0, Oct 2025
Windows, Mac
4.5
Değerlendirmeler: 6

Başlangıç 25/09/2024
38
Satışlar
Açıklama
Not: Sadece cTrader Windows üzerinde test edilmiştir.
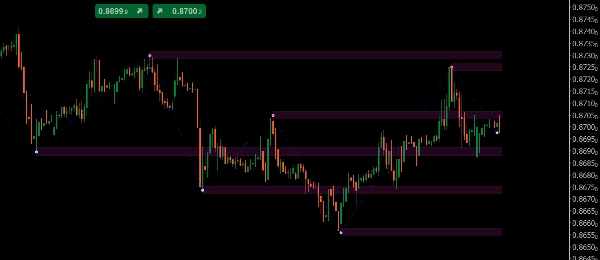
LT_Ind_SRZones salınım yüksek/düşüklerini algılar, yakın salınımları Destek/Direnç bölgelerine birleştirir ve grafiğinizi mevcut fiyat çevresindeki en ilgili seviyelere odaklar.
Çizdikleri
- Bölgeler: birleştirilmiş salınımlardan oluşan gölgeli bantlar
- Salınım Yüksek/Düşük noktaları
- ZigZag hızlı yapı okuması için yol
Ana Kontroller
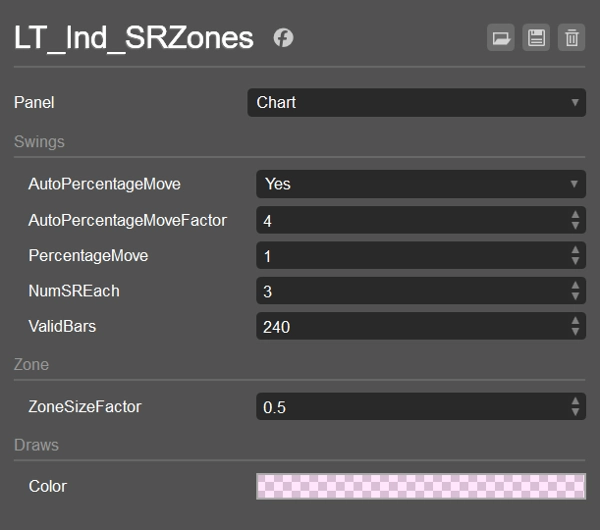
- AutoPercentageMove (bool) + AutoPercentageMoveFactor (double)
Salınım hassasiyetini otomatik ayarlar. Manuel olarak PercentageMove kullanmak için kapatın. - PercentageMove (double)
Otomatik kapalıyken salınım oluşturmak için minimum hareket (% olarak). - ZoneSizeFactor (double)
Bölge yüksekliği =ZoneSizeFactor × ATR. - NumSREach (int)
Mevcut fiyatın üstünde ve altında tutulacak en üst bölgelerin sayısı. - ValidBars (int)
Bu kadar bar'dan eski salınımları yoksay. - Renk / Gösterim stilleri
Bölge dolgu rengi (alfa ile), Salınım/ZZ stilleri.
Sıralama ve Filtre Mantığı (bölgelerin seçilme şekli)
- Salınımları topla en yeniden geriye doğru, sadece kalıcı olanları ve ValidBars'dan eski olmayan.
- Mevcut fiyatın üstündeki ve altındaki salınımları say (değeri yarım bölge içinde olanlar dahil). Her iki taraf da
NumSREachsayısına ulaşınca dur. - Yedek plan: bir tarafta uygun salınım yoksa, o taraf için bir eski salınım ekle.
- Birleştir: her hak sahibi salınım için, ya mevcut bir bölgeye birleştir (
CanMerge) ya da yeni bir bölge oluştur. - Sırala ve seç:
-
- Fiyatın üstünde: bölgeleri (Yüksek − fiyat) artan şekilde, sonra MostRecentIndex azalan şekilde sırala; al
NumSREach. - Fiyatın altında: (fiyat − Düşük) artan şekilde, sonra MostRecentIndex azalan şekilde sırala; al
NumSREach. - Birleştir iki listeyi → gösterilen nihai bölgeler.
- Fiyatın üstünde: bölgeleri (Yüksek − fiyat) artan şekilde, sonra MostRecentIndex azalan şekilde sırala; al
Bu, görüntüyü temiz, yakın ve güncel tutarken, kenar durumları da yönetir.
Varsayılanlar
- AutoPercentageMove = true, AutoPercentageMoveFactor = 4
- PercentageMove = 1.0 (Auto = false iken kullanılır)
- NumSREach = 1
- ValidBars = 240
- ZoneSizeFactor = 0.5 (bölge yüksekliği = 0.5 × ATR)
- Bölge Rengi = #21FF33E0 (yarı saydam)
- Salınım Yüksek = #FFFF999A, Salınım Düşük = #FF99DFF9, ZigZag = Mavi (Noktalar)
Kullanım Alanları
- Girişler, kısmi işlemler veya durdurmalar için yakın D/S bölgelerini işaretle
- Bölge dönüşlerini izle (destek → direnç ve tersi)
- Uyum için VWAP/Pivotlarla birleştir
Her sembol ve zaman diliminde çalışır. Hafif ve canlı işlem veya geriye dönük testlere hazır.
Özet
AI summary
LT_Ind_SRZones is an indicator designed for cTrader Windows that automatically identifies and displays support and resistance zones derived from swing highs and lows. It detects swing points, merges nearby swings into shaded support/resistance zones, and highlights the most relevant levels around the current price to maintain a clear chart view. The indicator also plots swing high/low points and a ZigZag path for quick structural analysis.
Key adjustable parameters include automatic or manual swing sensitivity settings, zone size based on a factor of the Average True Range (ATR), the number of top zones to display above and below the current price, and the maximum age of swings considered. The indicator filters and ranks zones by proximity and recency, ensuring the display focuses on recent and nearby levels.
LT_Ind_SRZones works on any symbol and timeframe, supporting markets such as Forex, indices, commodities, cryptocurrencies, and stocks. It is suitable for live trading and backtesting. Typical use cases include marking nearby support/resistance zones for trade entries, stops, or partial exits, monitoring zone flips (support to resistance and vice versa), and combining with other indicators like VWAP or pivots for confluence.
Key adjustable parameters include automatic or manual swing sensitivity settings, zone size based on a factor of the Average True Range (ATR), the number of top zones to display above and below the current price, and the maximum age of swings considered. The indicator filters and ranks zones by proximity and recency, ensuring the display focuses on recent and nearby levels.
LT_Ind_SRZones works on any symbol and timeframe, supporting markets such as Forex, indices, commodities, cryptocurrencies, and stocks. It is suitable for live trading and backtesting. Typical use cases include marking nearby support/resistance zones for trade entries, stops, or partial exits, monitoring zone flips (support to resistance and vice versa), and combining with other indicators like VWAP or pivots for confluence.
Gösterge profili
Müşteri değerlendirmeleri
4.5
Değerlendirmeler: 6
5 | 50 % | |
4 | 50 % | |
3 | 0 % | |
2 | 0 % | |
1 | 0 % |
Müşteri değerlendirmeleri
October 26, 2025
Good enough to keep watching for another week. A clean signal can still fail.
October 25, 2025
The logic holds up when bad setups become easier to pass on. It works better with a written plan.
October 22, 2025
October 15, 2025
the routine feels easier to keep, but the chart still needs a human read.
Tartışma
SSS
Prop
Forex
Indices
Commodities
Crypto
Stocks
cTrader Store üzerinden erişilebilen işlem botları, göstergeler ve eklentiler gibi ürünler, üçüncü taraf sağlayıcılar tarafından sağlanır ve yalnızca bilgilendirme ve teknik erişim amaçlarıyla sunulur. cTrader Store bir broker değildir ve yatırım tavsiyesi, kişisel öneriler vermez veya gelecekteki performansı garanti etmez.





















!["[CB] Pivot Points Pro" logosu](https://cdn.ctrader.com/image/webp/43463c82-67b0-4f10-a4ba-901bba091d81_32594)



Fiyat
Başlangıç 25/09/2024
38
Satışlar