
説明
最新バージョンは以下のリンクにあります
https://ctrader.com/products/2434?u=habibul.ghoni
# 🚀 プロフェッショナルVPFR(ボリュームプロファイル固定範囲)インジケーター - たったの10ドル!
## 高度なボリューム分析でトレーディングを変革
*機関投資家の取引の秘密を解き明かす*、cTraderプラットフォーム専用に設計された強力なボリュームプロファイル固定範囲インジケーターです。今なら驚きの価格、わずか*10ドル*で提供中 - 他の類似のプロフェッショナルツールのごく一部の価格です!
## 🎯 あなたを際立たせる主な特徴
### 📊 *高度なボリューム分布分析*
- *固定範囲ボリュームプロファイル*: 任意のカスタム日付範囲でボリューム分布を分析
- *スマート価格レベル分布*: 各バー内の複数の価格レベルにボリュームを自動分配
- *プロフェッショナルなボリューム計算*: 洗練されたアルゴリズムでボリューム密度を正確にマッピング
### 💎 *重要な取引レベル*
- *POC(ポイント・オブ・コントロール)*: 最もボリュームが多い価格レベルを即座に特定
- *バリューエリア高値(VAH)&安値(VAL)*: ボリュームの70%が発生した範囲を自動計算
- *カスタマイズ可能なバリューエリア*: 取引戦略に応じて50%から95%まで調整可能
### 🎨 *視覚的な優秀さ*
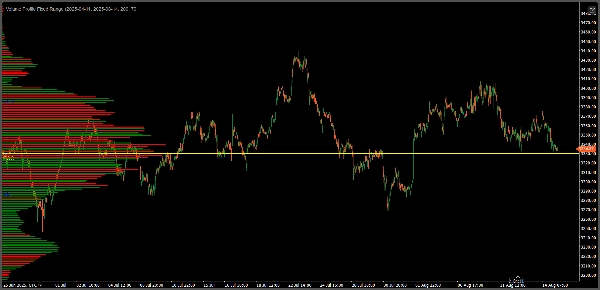
- *色分けされたボリュームバー*: 強気のボリュームは緑、弱気のボリュームは赤で表示
- *買い/売り圧力分析*: 各レベルでの買い圧力と売り圧力を区別
- *クリーンでプロフェッショナルな表示*: チャートを乱雑にしない水平ボリュームバー
- *スマートな配置*: 最適な視認性のために要素を自動配置
### ⚙ *完全なカスタマイズコントロール*
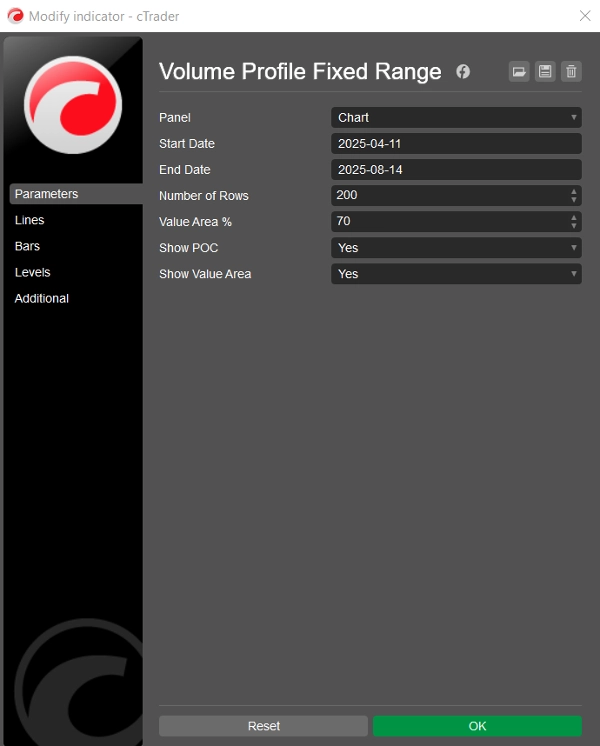
- *柔軟な日付範囲*: 分析の開始日と終了日を自由に設定可能
- *調整可能な解像度*: 完璧な粒度のために10から200の価格行を選択可能
- *機能の切り替え*: 必要に応じてPOCとバリューエリアのラインを表示/非表示
- *リアルタイム更新*: 最終バーに達すると自動的に再計算
## 💰 この10ドルの投資があなたのトレーディングを変える理由
### 🎯 *機関投資家レベルの洞察*
ほとんどの個人トレーダーは基本的な価格動向に頼りますが、*スマートマネー*はボリュームに基づいて取引します。このインジケーターは、プロのトレーダーや機関が使用するのと同じボリューム分析ツールを提供します。
### 📈 *複数の取引戦略*
- *サポート/レジスタンス取引*: POCはしばしば強力なサポート/レジスタンスとして機能
- *ブレイクアウト取引*: ボリュームプロファイルの端は潜在的なブレイクアウトポイントを示唆
- *平均回帰*: 価格は高ボリュームエリア(POC)に戻る傾向がある
- *レンジ取引*: バリューエリアは明確なレンジの境界を提供
### ⚡ *競争上の優位性*
- 類似のインジケーターは他のプラットフォームで50〜200ドル以上かかる
- 月額サブスクリプションや隠れた料金なし
- 一度の購入で生涯使用可能
- cTraderの高度なチャート機能と完全に連携
## 🔧 *簡単セットアップ&ユーザーフレンドリー*
- *プラグ&プレイ*: インストールしてすぐに取引開始可能
- *直感的なパラメーター*: 明確でわかりやすい設定
- *複雑な設定不要*: デフォルト設定で問題なく動作
- *軽量コード*: プラットフォームの動作を遅くしない
## 🎁 *たった10ドルで手に入るもの*
✅ 完全なVPFRインジケーターのソースコード
✅ プロフェッショナルなボリュームプロファイル分析
✅ POC識別システム
✅ バリューエリア計算エンジン
✅ 買い/売り圧力の可視化
## 🚨 *期間限定オファー - 通常価格29ドル*
このチャンスを逃さないでください!プロフェッショナルなボリューム分析ツールは通常数百ドルかかります。コーヒー一杯の価格で機関投資家レベルの洞察を手に入れましょう。
## 💯 *こんな方に最適:*
- ボリューム確認を求めるデイトレーダー
- 重要なレベルを特定するスイングトレーダー
- 最適なエントリー/エグジットポイントを探すスキャルパー
- ボリュームの優位性を求めるプロトレーダー
- 市場構造の理解に真剣なすべての方
*プロフェッショナルなボリューム分析で今日からトレーディングを変革しましょう。将来の利益を上げるあなた自身が感謝するはずです!*
---
cTraderプラットフォーム対応 | 購入後すぐにダウンロード可能 | 30日間返金保証
概要
The indicator visually distinguishes buy and sell pressure using color-coded volume bars (green for bullish, red for bearish) and displays horizontal volume bars that maintain chart clarity. It automatically distributes volume across multiple price levels within each bar using advanced algorithms for accurate volume density mapping.
Users can customize the analysis period, adjust the resolution from 10 to 200 price rows, and toggle visibility of POC and Value Area lines. The indicator updates in real time as new data arrives, supporting various trading strategies such as support/resistance, breakout, mean reversion, and range trading.
Volume Profile Fixed Range offers institutional-level volume analysis tools with an intuitive setup and lightweight code optimized for performance on cTrader charts. It is suitable for day traders, swing traders, scalpers, and professionals seeking enhanced market structure understanding.


