
説明
注意:cTrader Windowsのみでテスト済みです。
LT_SmartSwingsは、トレーダーが重要な転換点、市場の動き、ブレイクアウトイベントを明確かつ柔軟に視覚化できるよう設計された強力なスイングベースの市場構造インジケーターです。精度と適応性を追求して構築されており、スイングロジック、フィボナッチの合流、ブレイクアウト分析に依存するトレーダーに最適なツールです。
主な特徴:
- スイング高値/安値検出 価格変動率に基づく
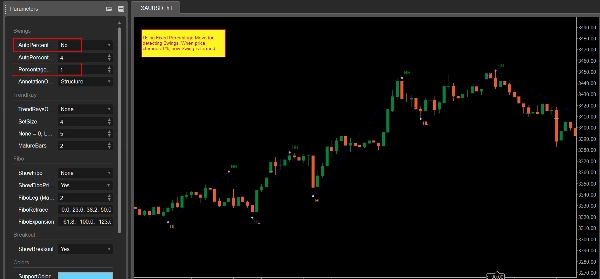
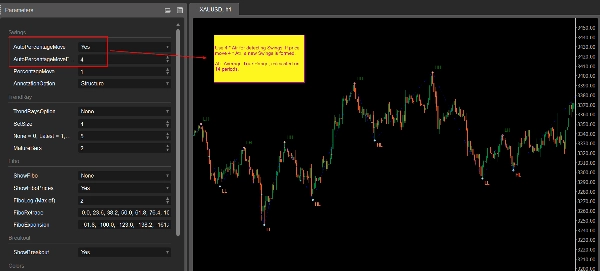
- 自動または手動の閾値: 固定%またはATR×係数に基づく自動モードを使用
- ジグザグライン 重要なスイングを接続
- 詳細な注釈 5つのモードで:
-
- 構造:HH、HL、LH、LL
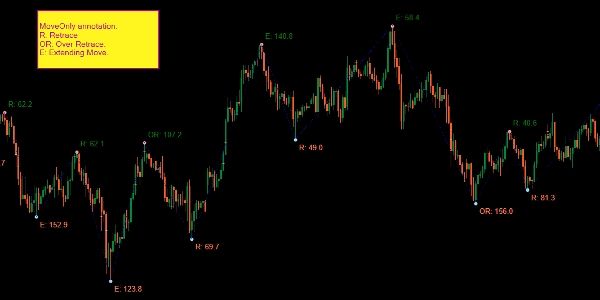
- MoveOnly:リトレース(R)およびエクステンション(E)のパーセンテージ
- PriceOnly
- MoveNPrice
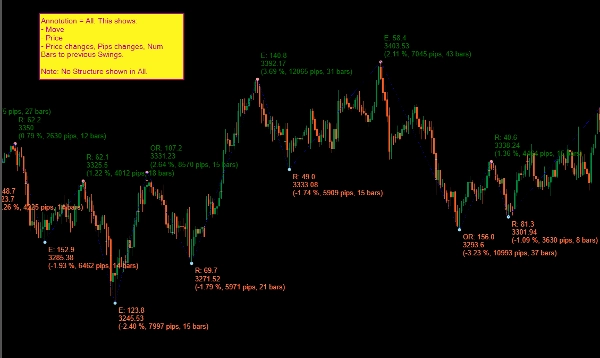
- All:動きの%、ピップ数、バー数、価格、動きの種類
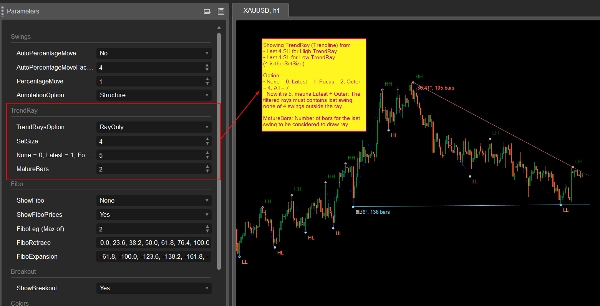
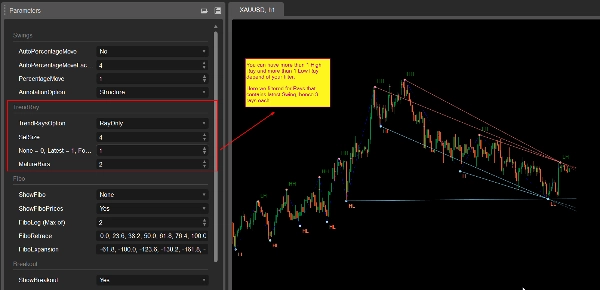
- トレンドレイ投影(複数のフィルタリングオプション付き):
-
- スマートな制約を用いて最近のスイングからレイを描画
- オプション:最新、フォーカス(傾き)、外側、またはすべて
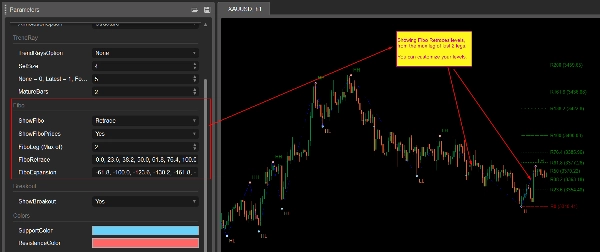
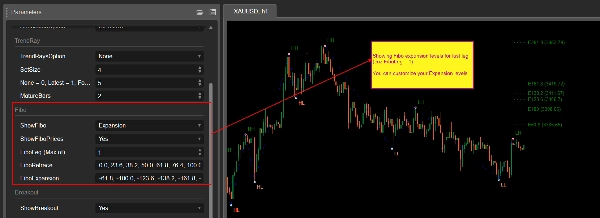
- 自動フィボナッチレベル:
-
- 最近の動きに基づくリトレースメントまたは拡張レベルを描画
- ユーザー設定可能なレベルセット
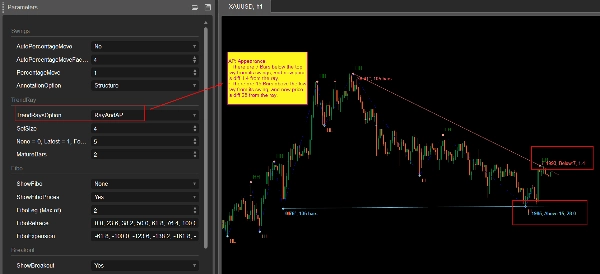
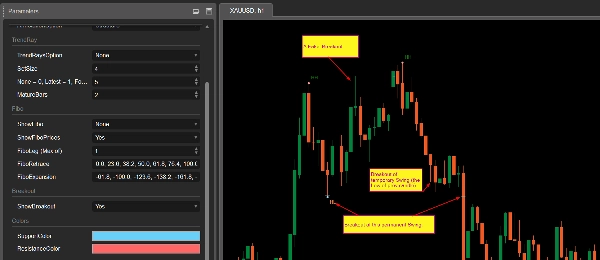
- ブレイクアウトマーキング:
-
- スイングポイントのブレイクアウトを検出(確定および偽のブレイクアウト両方)
- 履歴参照のための持続的表示
- サポート/レジスタンスラインの色カスタマイズ
使用例:
- サポート/レジスタンスを動的に特定
- スイング構造と移行を理解
- フィボナッチを使ったトレンド継続または反転の識別
- 取引計画のためのブレイクアウトポイントの視覚化
- 既存のシステムや裁量戦略と組み合わせて使用
推奨使用法:
- 作業中の時間軸にアタッチ(例:M30、H1)
- 手動トレーダー、構造分析者、確認ベースの戦略に最適
ローンチオファー:今ならわずか15ドルでご利用いただけます!
概要
AIによる概要
LT_SmartSwings is a swing-based market structure indicator designed for traders to identify key turning points, market moves, and breakout events with precision and flexibility. It detects swing highs and lows based on price movement percentage, using either fixed or automatic thresholds derived from ATR. The indicator connects key swings with a ZigZag line and provides detailed annotations in five modes, including structure (HH, HL, LH, LL), move percentages, price-only, combined move and price, and comprehensive move data.
Additional features include trend ray projection with multiple filtering options, automatic Fibonacci retracement and expansion levels customizable by the user, and breakout marking that detects both confirmed and false breakouts with persistent historical display. Support and resistance lines can be color-customized.
Use cases cover dynamic support/resistance identification, understanding swing structure and transitions, spotting trend continuation or reversal via Fibonacci levels, visualizing breakout points for trade planning, and integration with existing trading systems or discretionary strategies. It is recommended for manual traders, structure analysts, and confirmation-based strategies, and is intended for use on working timeframes such as M30 or H1. The indicator has been tested on cTrader Windows.
インジケーターのプロフィール
カスタマーレビュー
5.0
レビュー: 1
5 | 100 % | |
4 | 0 % | |
3 | 0 % | |
2 | 0 % | |
1 | 0 % |
ディスカッション
よくあるご質問
Breakout
ATR
cTrader Storeで入手可能な取引ボット、インジケーター、プラグインなどの商品は、第三者の開発者が提供するものであり、情報と技術の取得のみを目的としてご利用いただけます。cTrader Storeはブローカーではなく、投資助言や個人的な推奨を行うことも、将来のパフォーマンスを保証することもありません。


価格
登録日 25/09/2024
35
販売