
Opis
Przegląd
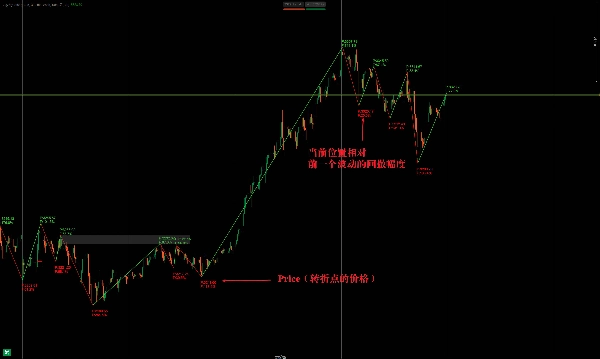
Wskaźnik ZigZag to narzędzie analizy technicznej, które służy głównie do identyfikacji kluczowych punktów odwrócenia cen poprzez filtrowanie szumów rynkowych. Łączy istotne maksima i minima liniami ZigZag, pomagając traderom wizualizować trendy i potencjalne wybicia.
Jak działa ZigZag
- Podstawowa funkcjonalność
-
- Eliminuje drobne wahania cen, ustawiając minimalny próg zmiany ceny (procentowy lub stały).
- Łączy tylko znaczące maksima/minima, upraszczając analizę trendu.
- Często używany do wykrywania poziomów wsparcia/oporu, odwróceń (np. głowa i ramiona, podwójne szczyty/dna).
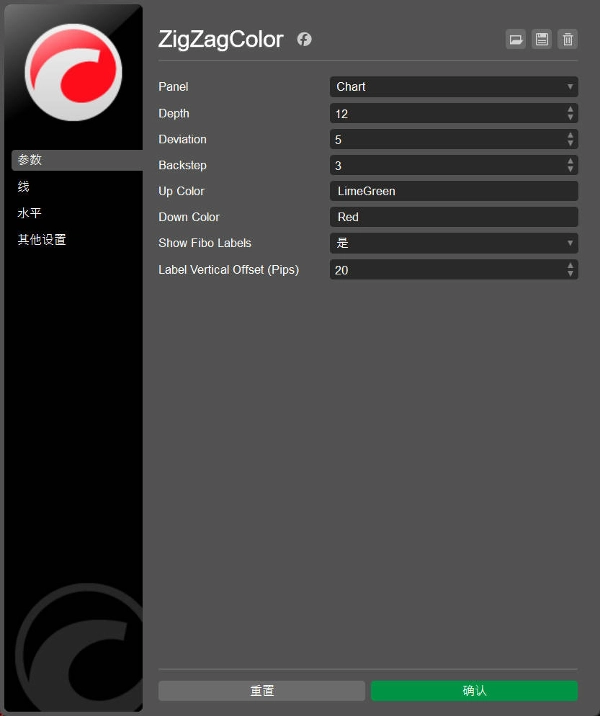
- Kluczowe parametry
-
- Minimalny ruch cenowy (%): Określa czułość (np. 5% ignoruje ruchy mniejsze niż ten próg).
- Głębokość analizy wstecznej: Kontroluje, ile świec wstecz jest analizowanych, wpływając na opóźnienie.
Główne zastosowania
1. Identyfikacja trendu
- Trend wzrostowy: Wyższe maksima (HH) + wyższe minima (HL).
- Trend spadkowy: Niższe maksima (LH) + niższe minima (LL).
- Pomaga rysować linie trendu dla potencjalnych transakcji na wybicia.
2. Rozpoznawanie formacji
- Ukazuje klasyczne formacje wykresów (trójkąty, flagi, kliny) poprzez definiowanie punktów zwrotnych.
3. Poziomy zniesień Fibonacciego
- Oznacza wyraźne maksima/minima dla ekstensji lub zniesień Fibonacciego.
4. Wykrywanie dywergencji
- Wyróżnia dywergencje między ceną a oscylatorami (RSI, MACD).
Wskaźnik ZigZag to narzędzie analizy technicznej, które służy głównie do identyfikacji kluczowych punktów zwrotnych w trendzie cenowym, pomagając traderom filtrować szumy rynkowe i podkreślać ważne maksima i minima. Poniżej przedstawiono jego kluczowe cechy i zastosowania:
Zasada działania wskaźnika ZigZag
- Podstawowe funkcje:
-
- Poprzez ustawienie progu zmiany ceny (procentowego lub stałego), automatycznie ignoruje niewielkie wahania, łącząc tylko znaczące maksima i minima, tworząc linię łamaną (kształt ZigZag).
- Często stosowany do wspomagania identyfikacji poziomów wsparcia/oporu oraz odwróceń trendu (np. formacje głowy i ramion, podwójne dna itp.).
- Kluczowe parametry:
-
- Minimalna amplituda ruchu (np. 5% lub w punktach): decyduje o czułości filtra na małe wahania. Im większa wartość, tym mniej sygnałów, ale są one bardziej wiarygodne.
- Głębokość cofania: kontroluje liczbę świec branych pod uwagę przy obliczeniach, wpływając na opóźnienie punktów zwrotnych.
Główne zastosowania
- Identyfikacja trendu:
-
- Określanie kierunku trendu przez kolejne wyższe maksima (trend wzrostowy) lub niższe minima (trend spadkowy).
- W połączeniu z liniami trendu umożliwia wcześniejsze przewidywanie wybicia lub korekty.
- Analiza formacji:
-
- Rozpoznawanie klasycznych formacji cenowych (np. trójkąty, flagi), gdzie linie ZigZag wyraźnie pokazują granice formacji.
- Współpraca z narzędziami Fibonacciego:
-
- Wykorzystanie oznaczonych przez ZigZag punktów zwrotnych jako punktów startu/końca dla zniesień lub rozszerzeń Fibonacciego.
- Wykrywanie dywergencji:
-
- Pomaga potwierdzić punkty początku i końca dywergencji między ceną a wskaźnikami (np. RSI, MACD).
Podsumowanie
Profil wskaźnika
Opinie klientów
0.0
Opinie: 0
Opinie klientów
Ten produkt nie ma jeszcze opinii. Wypróbowałeś(-aś) go już? Bądź pierwszy(-a) i powiedz o tym innym!
Dyskusja
Częste pytania
Prop
Forex
Breakout
Indices
Commodities
RSI
Crypto
Stocks
MACD
Produkty dostępne za pośrednictwem cTrader Store, w tym boty handlowe, wskaźniki i wtyczki, dostarczane są przez deweloperów zewnętrznych i udostępniane wyłącznie w celach informacyjnych oraz w celu zapewnienia dostępu technicznego. cTrader Store nie jest brokerem i nie zapewnia doradztwa inwestycyjnego, nie udziela spersonalizowanych rekomendacji ani nie gwarantuje przyszłych wyników.


![Logo „[Hamster-Coder] Bollinger Bands”](https://cdn.ctrader.com/image/webp/21d8e5d6-fb11-4bac-b9ee-cd05c2b76804_30327)


Cena
Od 30/09/2024
44
Sprzedaż