
Average Cost Price
Indicateur
1 achats
Version 1.0, Sep 2025
Windows, Mac
4.5
Avis : 2
Description
Déterminer le prix moyen de revient pour plusieurs transactions est difficile. Fixer un Stop Loss et un Take Profit est compliqué car le prix moyen de plusieurs transactions est inconnu.
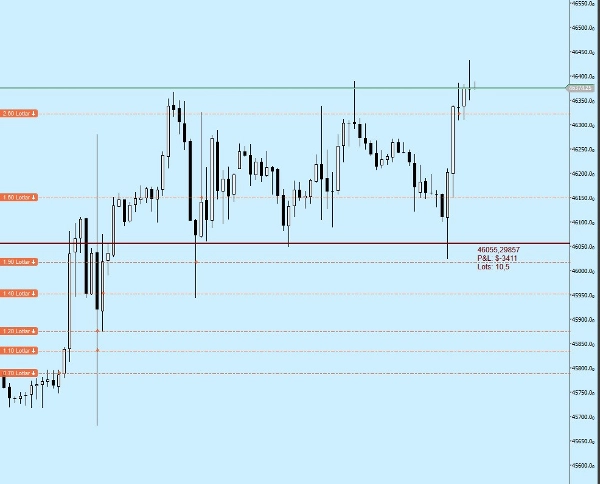
L'indicateur Prix Moyen de Revient vous fournit :
* Ligne du prix moyen d'achat ou de vente,
* Montant total du profit ou de la perte basé sur la ligne du prix moyen,
* Quantité totale de lots
Résumé
Résumé IA
Average Cost Price is a trading indicator designed to help traders monitor their open positions directly on the chart. It calculates and displays the average buy or sell price line for multiple trades, simplifying the process of managing positions with varying entry prices. The indicator also shows the total profit or loss amount based on this average cost line, providing a clear overview of overall position performance. Additionally, it tracks the total lot quantity held. This tool supports various markets including Forex, Stocks, Commodities, Crypto, and Indices, and is applicable to symbols such as BTCUSD, EURUSD, GBPUSD, XAUUSD, and USDJPY. By consolidating multiple trade entries into a single average cost metric, it aids in setting more accurate Stop Loss and Take Profit levels.
Profil de l'indicateur
Avis clients
4.5
Avis : 2
5 | 50 % | |
4 | 50 % | |
3 | 0 % | |
2 | 0 % | |
1 | 0 % |
Avis clients
October 3, 2025
ngl, trade control feels cleaner and that is enough to keep testing it. Win rate means less without average R.
October 1, 2025
The tool feels better once the workflow feels calmer, and spread and slippage need a line in the notes.
Discussion
Questions fréquentes
BTCUSD
Prop
Forex
Indices
EURUSD
Commodities
GBPUSD
Crypto
Stocks
XAUUSD
USDJPY
Les produits disponibles sur cTrader Store, notamment les bots de trading, les indicateurs et les plug-ins, sont fournis par des développeurs tiers et mis à disposition à titre informatif et à des fins d'accès technique uniquement. cTrader Store n'est pas un courtier et ne fournit aucun conseil en investissement, aucune recommandation personnelle ni aucune garantie quant aux performances futures.


![Logo de "[Hamster-Coder] Pivot Points MTF"](https://cdn.ctrader.com/image/webp/4c143e5a-309c-40e3-a578-f04d1e133ffa_31159)


Prix
Depuis le 01/09/2025
1
Ventes