
Penerangan
Memperkenalkan Penunjuk Indeks Kekuatan Sebenar (TSI), alat yang berkuasa direka untuk meningkatkan strategi perdagangan anda dengan memberikan pandangan yang jelas mengenai momentum pasaran dan kekuatan tren.
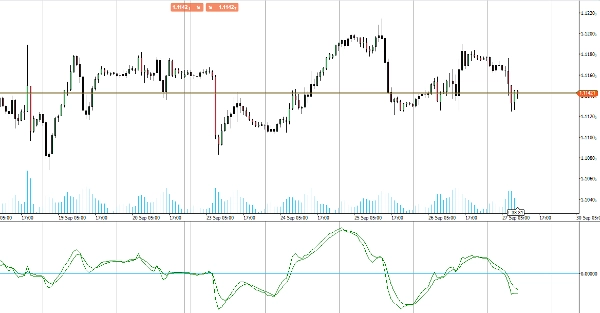
Penunjuk TSI mengukur kekuatan asas pergerakan harga, melicinkan bunyi pasaran untuk memberikan gambaran yang lebih tepat tentang arah tren. Dengan menonjolkan keadaan terlebih beli dan terlebih jual, TSI membantu anda mengenal pasti titik pembalikan yang berpotensi dan mengesahkan kesinambungan tren.
TSI menggunakan purata bergerak daripada momentum asas instrumen kewangan. Momentum dianggap sebagai penunjuk utama pergerakan harga, dan purata bergerak biasanya tertinggal di belakang harga. TSI menggabungkan ciri-ciri ini untuk mencipta petunjuk harga dan arah yang lebih selari dengan perubahan pasaran berbanding sama ada momentum atau purata bergerak.
Sesuai untuk pedagang yang ingin memperhalusi analisis mereka dan meningkatkan pembuatan keputusan, penunjuk TSI menawarkan cara yang boleh dipercayai dan intuitif untuk mengukur dinamik pasaran. Tingkatkan alat perdagangan anda dengan Indeks Kekuatan Sebenar untuk prestasi perdagangan yang unggul.


![Logo "[Hamster-Coder] Bollinger Bands"](https://cdn.ctrader.com/image/webp/21d8e5d6-fb11-4bac-b9ee-cd05c2b76804_30327)


