
Description
Hull Moving Average Colored – Direction de la tendance en un coup d'œil
Présentation
Hull Moving Average Colored est un indicateur de suivi de tendance simplifié qui applique la réactivité de la Hull Moving Average avec des signaux directionnels codés par couleur. En affichant les tendances haussières en vert et les tendances baissières en rouge, il fournit une confirmation visuelle instantanée de la direction du momentum sans nécessiter d'analyse complexe.
Ce qu'il fait
Fondation de la Hull Moving Average : L'indicateur utilise la Hull Moving Average (HMA), une moyenne mobile à réaction rapide conçue pour réduire le décalage tout en maintenant la fluidité. Contrairement aux moyennes mobiles traditionnelles, la HMA privilégie l'action des prix récents, ce qui la rend particulièrement utile pour détecter tôt les changements de tendance.
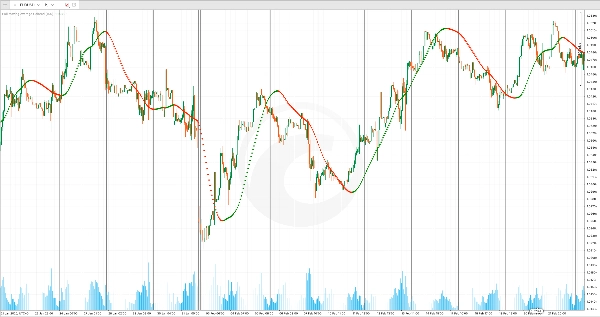
Visualisation de la tendance codée par couleur : Au lieu d'une seule ligne, l'indicateur trace des points directionnels :
- Points verts : Apparaissent lorsque la HMA est en hausse, indiquant un momentum haussier
- Points rouges : Apparaissent lorsque la HMA est en baisse, indiquant un momentum baissier
Ce système binaire de couleurs rend la direction de la tendance indubitable d'un seul coup d'œil—pas besoin d'interpréter la pente ou de comparer aux barres précédentes.
Caractéristiques principales
Affichage en superposition : L'indicateur s'affiche directement sur votre graphique de prix, vous permettant de voir la direction de la tendance par rapport aux niveaux de prix réels. Cela facilite la détection des ruptures de prix au-dessus ou en dessous de la moyenne mobile, signalant des points d'entrée et de sortie potentiels.
Réduction réactive du décalage : La Hull Moving Average réagit plus rapidement que les moyennes mobiles exponentielles ou simples standard, ce qui la rend particulièrement efficace pour les traders swing et intraday qui ont besoin de signaux opportuns sans faux signaux excessifs.
Personnalisation simple : Ajustez le paramètre Période pour contrôler la sensibilité. Des périodes plus courtes (par exemple, 20-32) rendent l'indicateur plus réactif aux mouvements récents mais sujet à de faux signaux sur des marchés instables. Des périodes plus longues (par exemple, 64-128) offrent des tendances plus lisses avec moins de fausses cassures mais peuvent manquer des retournements rapides.
Utilisation pratique
Utilisez Hull Moving Average Colored comme un filtre rapide pour la direction des trades. Ne prenez des positions longues que lorsque des points verts apparaissent et que le prix est au-dessus de la moyenne ; ne prenez des positions courtes que lorsque des points rouges apparaissent et que le prix est en dessous de la moyenne. Inversement, considérez les changements de couleur comme des signaux potentiels de sortie—lorsque le vert passe au rouge, il est temps de réévaluer vos positions longues.
L'indicateur fonctionne bien sur les marchés en tendance et est particulièrement utile sur des unités de temps plus élevées (4 heures et journalières) où il peut vous aider à vous aligner avec la tendance directionnelle plus large avant de trader sur des configurations de plus bas intervalles.
Résumé
This indicator overlays directly on price charts and uses a binary color system to indicate trend direction: green points appear when the HMA is rising, signaling upward momentum, and red points appear when the HMA is falling, signaling downward momentum. This visual approach allows traders to quickly identify trend direction without interpreting slopes or comparing previous bars.
Users can adjust the period parameter to control sensitivity—shorter periods increase responsiveness but may generate more false signals, while longer periods smooth trends but may delay signals. The indicator is suitable for various markets including Forex, indices, stocks, and cryptocurrencies such as BTCUSD and XAUUSD. It is particularly useful on higher timeframes (4-hour and daily) for aligning with broader market trends and can assist in identifying potential entry and exit points based on trend changes.
Avis clients
5 | 0 % | |
4 | 100 % | |
3 | 0 % | |
2 | 0 % | |
1 | 0 % |


