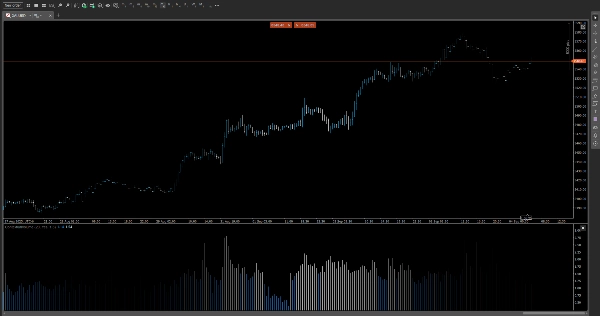
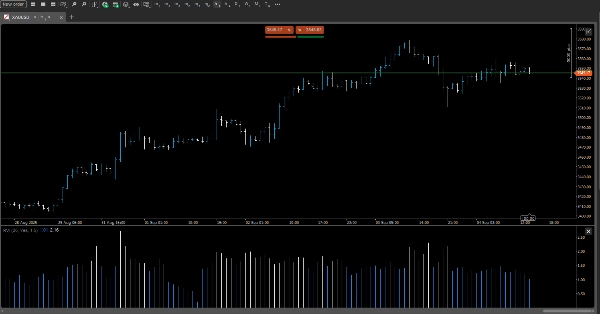
Chỉ báo
Indices
Prop
Breakout
Commodities
Forex
Crypto
RVI
Logo "RVI"
04/09/2025
Desktop
Ảnh "RVI" được tải lênẢnh "RVI" được tải lên

📊 Relative Volume Intraday (RVI)

Spot the volume surges that matter—when they matter.

RVI is a precision-crafted indicator that compares current volume to its historical average for the same time of day, revealing hidden momentum and liquidity shifts across intraday sessions.


🔍 Key Features

Time-of-Day Volume Profiling

Calculates average volume per time slot (e.g., 10:15 AM) across previous sessions, giving you a contextual benchmark for every candle.

Multi-Timeframe Support

Works seamlessly from 5-minute charts up to 12-hour timeframes, adapting to your trading style—scalping, swing, or session-based.

Dynamic Color Coding

Highlights candles with above-average volume using customizable color thresholds. Instantly spot high activity zones with intuitive visual cues.

Ratio vs. Difference Mode

Choose your preferred metric:

Ratio Mode: Displays current volume ÷ average volume (e.g., 2.3×)

Difference Mode: Shows absolute deviation (e.g., +1,200 contracts)

Overlay or Panel Display

Toggle between inline chart overlays or a compact side panel for clean integration with your existing layout.


🎯 Use Cases

Confirm breakout strength with volume spikes relative to typical activity

Filter false signals during low-volume periods

Identify institutional footprints during key intraday windows

Enhance volume-based strategies with time-aware context


⚙️ Customization Options

Adjustable lookback period for historical averaging

User-defined color thresholds for volume intensity

Toggle display mode (Ratio/Difference)

Compatible with dark/light themes

0.0
Đánh giá: 0
Đánh giá của khách hàng
Sản phẩm này chưa có đánh giá nào. Bạn đã dùng thử chưa? Hãy là người đầu tiên chia sẻ với mọi người!
Sản phẩm khác của tác giả này
FVG
The Indicator is a powerful tool for price-action traders seeking to identify and exploit short-term imbalances.
Chỉ báo
Indices
Prop
Stocks
+3
Fractals
Fractals is a precision-engineered trading indicator for cTrader that reveals the hidden architecture of price action.
Chỉ báo
Grid
NAS100
XAUUSD
+6
AutoFibRetracement
A powerful overlay tool designed to automatically plot Fibonacci retracement levels based on a custom window.
Chỉ báo
Indices
Prop
Stocks
+3
Smooth Heiken Ashi
The Smooth Heiken Ashi indicator is a refined charting tool designed to filter out market noise and highlight true price
Chỉ báo
NAS100
Indices
XAUUSD
+4
PrevDayProjection
Automatically calculates the previous day’s high and low, determines the range, and then projects Fibonacci levels.
Chỉ báo
NAS100
Indices
XAUUSD
+6
JacksonZones
Maps intraday and multiday structure using Fibonacci-projected session ranges.
pATR
An indicator that redefines ATR by applying a percentile-based filter giving traders a grounded view of volatility.
DEnvelopSystem
DEnvelop is a high-performance trading indicator engineered for scalpers and intraday strategists who demand precision.
Chỉ báo
Breakout
AI
Scalping
KaufmanEfficiencyRatio
A precision tool for measuring how efficiently price moves from point A to B.
Chỉ báo
Indices
Prop
Commodities
+3
OBScope
A cutting-edge indicator designed to detect and visualize high-probability zones based on swing highs, swing lows.
Chỉ báo
NAS100
Indices
XAUUSD
+7
T3 Moving Average
A next‑generation moving average designed to deliver exceptional smoothness with minimal lag.
Chỉ báo
Indices
XAUUSD
Breakout
+3
AnchoredVWAP
A precision overlay tool that combines session-aware VWAP logic and standard deviations.
Chỉ báo
Indices
Breakout
Prop
+8
MarketRegimeAI
A cutting‑edge trading indicator that fuses AI and mathematics with adaptive logic to classify market regimes.
Chỉ báo
NAS100
Indices
XAUUSD
+7
InstitutionalSignalOscillator
A precision-engineered indicator designed for traders who demand signal integrity across volatile markets.
cBot
NAS100
Indices
XAUUSD
+4
VolatilityScalper
A trading robot designed for traders who want precision for high-volatility markets (XAUUSD, US500, US100, WTI, others.)
Chỉ báo
Indices
Commodities
Stocks
+2
MARainbow
MARainbow gives you the edge with four customizable moving averages—each color-coded for instant recognition.
Bạn cũng có thể thích
Chỉ báo
Indices
RSI
Commodities
+1
OrderPrice-V3
A straightforward yet effective tool signals entry points for both buying and selling. Include 3 Moving Average
Tiny_Aim_Trainer
trading stress-relief “mini-game”
Chỉ báo
NAS100
NZDUSD
XAUUSD
+10
Candle Count
Label each candle sequentially with flexible session resets.
Chỉ báo
Indices
RSI
XAUUSD
+9
RsiMultiFrameOBOS
Multi-Timeframe Trend Dots RSI
Candle Timer & Strength Panel Demo -
Candle Timer & Strength Panel DEMO for cTrader DEMO VERSION – 24 hours free trial! This is a DEMO version of the Candle
MM-Symbol Info (free)
Enhance the trading experience with real-time Spread, Time To Close, rPNL, uPNL, PNL and minimalistic Bid / Ask lines
Chỉ báo
NZDUSD
Forex
EURUSD
+2
4 RCS Relative Strength w Alerts_NSC
Forex Strength Meter for cTrader: 4 custom currencies, cross alerts, visual arrows. Trade smarter!
Chỉ báo
NAS100
NZDUSD
Martingale
+22
Zigzag Trend
The ZigZag Trend is a market structure tool that filters out small price fluctuations and highlights major swing.
Renko 4k Pips
Custom your Renko Brick how do you wish!
Chỉ báo
NAS100
NZDUSD
Breakout
+14
Matrix Pro by PrimeQuant
Multi-timeframe S/R, SRWMA trend & Demarker pivots with smart alerts—clarity for any market, any timeframe.
Chỉ báo
RSI
MACD
Multi-Timeframe Market Levels
Unlock market insights with our Multi-Timeframe Market Levels indicator, enhancing your trading strategies effortlessly
Chỉ báo
RSI
Breakout
XAUUSD
+5
Prediction Based on Linreg & ATR
📊Predicts price movement by combining multi-timeframe trend analysis, market volatility 📉, and..
Chỉ báo
Bollinger
E7 Indicators Free Overlays
Bollinger Band Cloud, Heiken Ashi, Trend Follower and Parabolic SAR.
FractalArrowBuySell
Fractal Arrow Buy and Sell Indicator
Chỉ báo
Forex
EURUSD
EconomicForex
ECONOMIC FOREX:provides insights into inflation, nominal interest rates and real interest rates, in the line chart
Chỉ báo
Indices
Forex
USDJPY
JPYX w HMA
JPYX Indicator with HMA
Fury Team E_M_A_su_TF
EMA ON TF (MULTI-TIMEFRAME)
Chỉ báo
XAUUSD
Martingale
Commodities
+2
cAlgoBuddy - Zone Recovery
The Zone Recovery indicator is used in an advanced hedging strategy, opening traders in the opposite direction.