
FVG
Chỉ báo
1.07K lượt tải
Phiên bản 1.1, Dec 2025
Windows, Mac
Mô tả
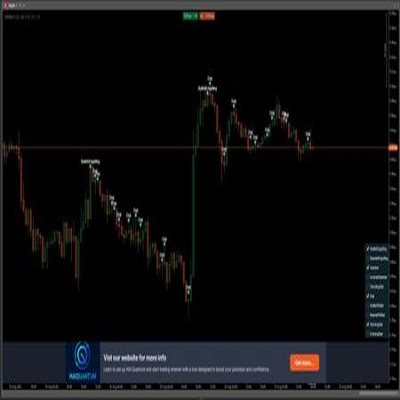
🧠 Chỉ Báo Fair Value Gap (FVG)
Tiết Lộ Các Mất Cân Bằng Thị Trường Ẩn Với Độ Chính Xác
Chỉ Báo Fair Value Gap (FVG) là một công cụ mạnh mẽ dành cho các nhà giao dịch theo hành động giá, nhằm xác định và tận dụng các bất hợp lý ngắn hạn do dòng lệnh tổ chức mạnh mẽ gây ra. Được xây dựng trên logic 3 thanh nến vững chắc, nó tự động phát hiện các vùng FVG tăng và giảm — những khu vực mà giá có thể quay lại trước khi tiếp tục xu hướng.
🔍 Tính Năng Chính
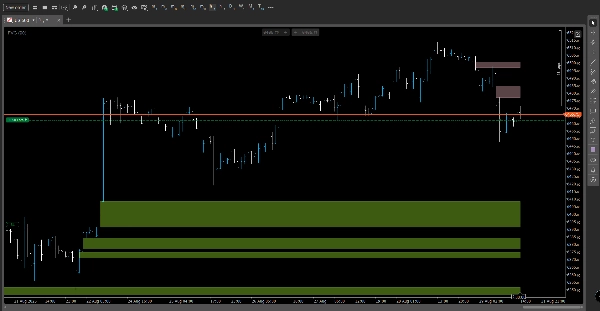
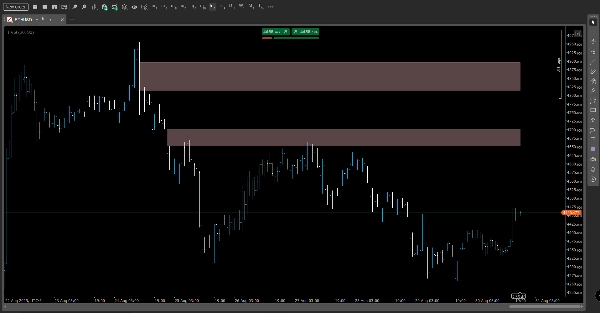
- Phát Hiện FVG Tự Động: Làm nổi bật các vùng mất cân bằng bằng các hình chữ nhật sạch, không vẽ lại dựa trên khoảng trống giữa các cây nến.
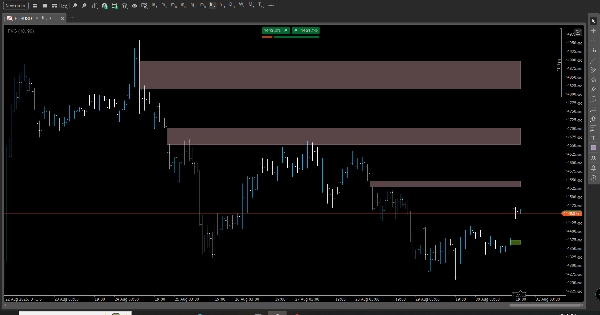
- Theo Dõi Việc Giảm Thiểu: Giám sát khi giá quay lại và lấp đầy khoảng trống, cập nhật hình ảnh và ghi lại các sự kiện giảm thiểu.
- Hiển Thị Vùng Chưa Giảm Thiểu: Hiển thị các FVG đang hoạt động dưới dạng các đường ngang đậm để tham khảo nhanh và lập kế hoạch giao dịch.
- Ngưỡng Điều Chỉnh Thích Ứng: Chọn chế độ ngưỡng thủ công hoặc tự động để điều chỉnh độ nhạy phù hợp với thị trường biến động hoặc yên tĩnh.
- Hình Ảnh Tùy Chỉnh: Cấu hình màu sắc, độ mờ và độ dài chiếu để phù hợp với phong cách biểu đồ của bạn.
- Ghi Nhật Ký Trên Terminal: Nhật ký gọn gàng báo cáo tổng số khoảng trống, các lần giảm thiểu và vùng đang hoạt động — hoàn hảo để xác thực chiến lược.
🎯 Lợi Ích
- Tham Chiếu Giao Dịch Rõ Ràng: Sử dụng các vùng FVG làm mục tiêu quay lại, khu vực phản ứng hoặc điểm hội tụ với các khái niệm tiền thông minh khác.
- Dấu Ấn Hình Ảnh Thấp: Thiết kế sạch sẽ giữ cho biểu đồ của bạn dễ đọc trong khi vẫn bảo tồn bối cảnh mất cân bằng thiết yếu.
- Kiểm Tra Lại Đáng Tin Cậy: Logic thanh đóng đảm bảo tín hiệu ổn định mà không vẽ lại.
- Sẵn Sàng Cho Nhiều Khung Thời Gian: Lý tưởng cho các nhà giao dịch lướt sóng, giao dịch swing và các nhà phân tích phong cách tổ chức.
👤 Dành Cho Ai
- Các Nhà Giao Dịch Smart Money & ICT
- Người Theo Chủ Nghĩa Hành Động Giá
- Các Nhà Phân Tích Định Lượng xác nhận phản ứng dòng lệnh
- Các Nhà Giao Dịch tìm kiếm điểm vào có xác suất cao dựa trên cấu trúc thị trường
Tóm tắt
Tóm tắt AI
The Fair Value Gap (FVG) Indicator is designed for price-action traders to identify short-term market imbalances caused by institutional order flow. It uses a 3-bar logic to automatically detect bullish and bearish FVG zones—price gaps where the market may return before continuing its trend. Key features include automated detection with non-repainting rectangles, mitigation tracking that updates when gaps are filled, and an overlay of active unmitigated zones for easy reference. Users can adjust sensitivity via manual or automatic threshold modes and customize visual elements such as colors and opacity. The indicator logs gap statistics and mitigation events in the terminal for strategy validation. It supports multi-timeframe analysis, making it suitable for scalpers, swing traders, and institutional-style analysts. The FVG Indicator provides clear trade reference points, a low visual footprint to maintain chart readability, and reliable backtesting signals based on closed-bar logic. It is intended for traders focused on smart money concepts, price action, and order-flow validation seeking high-probability entries aligned with market structure.
Hồ sơ chỉ báo
Đánh giá của khách hàng
0.0
Đánh giá: 0
Đánh giá của khách hàng
Sản phẩm này chưa có đánh giá nào. Bạn đã dùng thử chưa? Hãy là người đầu tiên chia sẻ với mọi người!
Thảo luận
Câu hỏi thường gặp
Các sản phẩm có sẵn trên cTrader Store, bao gồm bot giao dịch, chỉ báo và plugin, được cung cấp bởi các nhà phát triển bên thứ ba và chỉ nhằm mục đích cung cấp thông tin và tiếp cận kỹ thuật. cTrader Store không phải là nhà môi giới và không cung cấp lời khuyên đầu tư, khuyến nghị cá nhân hay bất kỳ đảm bảo nào về hiệu suất trong tương lai.


Giá
26
Lượt bán
2.14K
Cài đặt miễn phí