
Mô tả
CVD ai
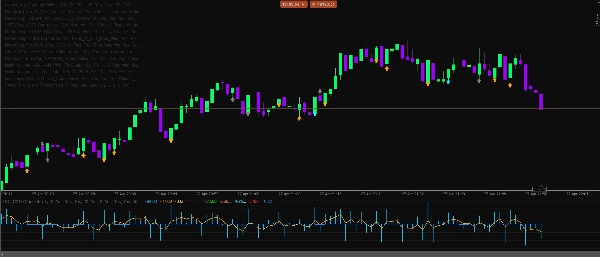
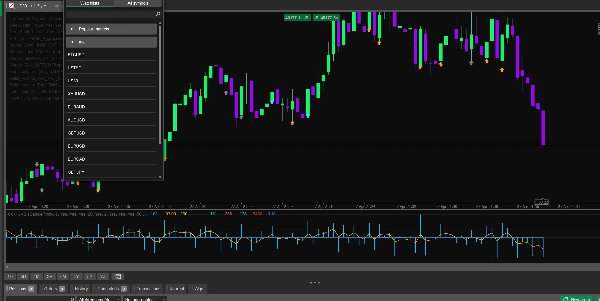
Delta CVD Advanced là một chỉ báo phân tích động lượng và lệnh chuyên nghiệp được thiết kế cho các nhà giao dịch muốn có cái nhìn rõ ràng hơn về áp lực mua và bán trực tiếp từ hành vi thị trường. Nó kết hợp Delta, CVD, động lượng tick trực tiếp, hấp thụ, phân kỳ, bộ lọc phiên, bảo vệ biến động và một động cơ hội tụ thông minh thành một công cụ phân tích sạch sẽ duy nhất.
Chỉ báo này được xây dựng cho việc lướt sóng, giao dịch trong ngày và xác nhận động lượng ngắn hạn trên các thị trường Forex, Vàng, Chỉ số, Tiền điện tử và Dầu.
Các Tính Năng Chính
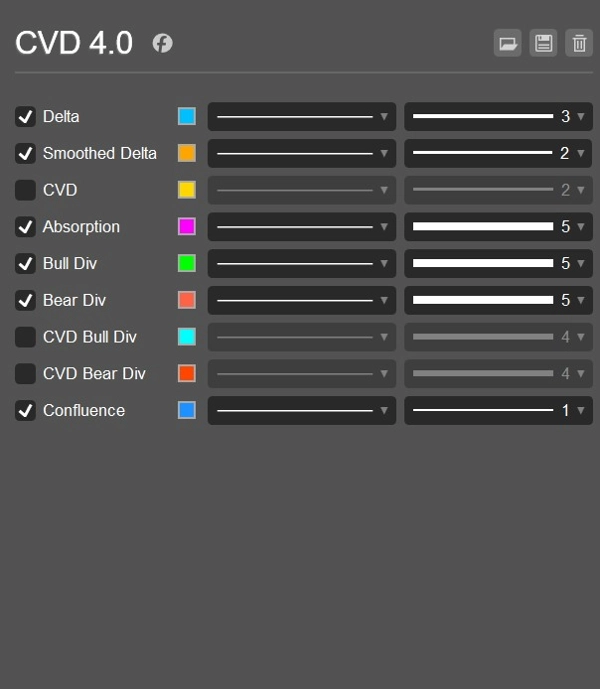
- Tính toán Delta trực tiếp sử dụng logic uptick/downtick
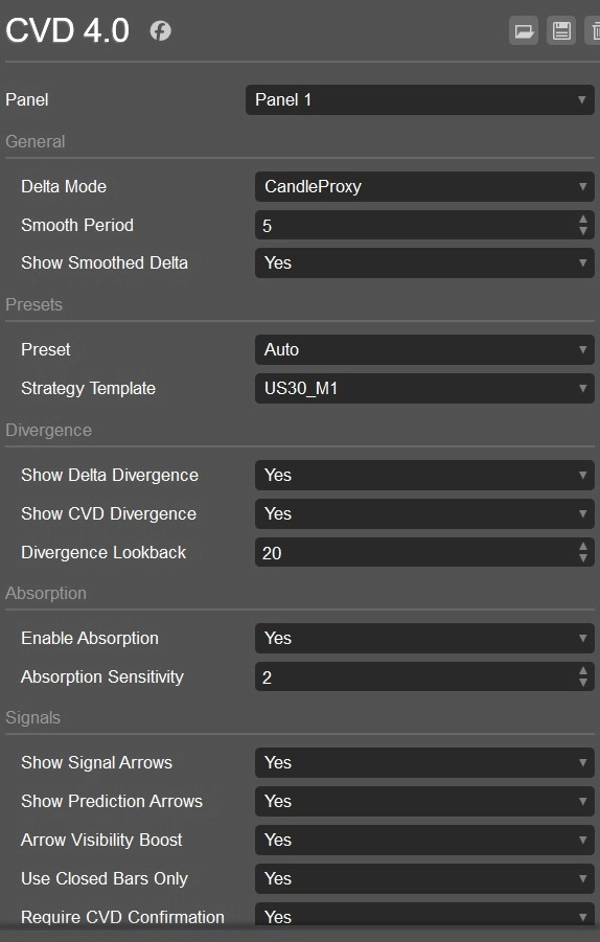
- Chế độ delta đại diện nến cho phân tích lịch sử
- Đường Cumulative Volume Delta để theo dõi áp lực theo thời gian
- Đường Delta làm mượt để đọc động lượng rõ ràng hơn
- Biểu đồ Delta màu cho Mua/Bán
- Tính toán động lượng dựa trên tick cho xung thị trường trực tiếp
- Chế độ động lượng lai kết hợp độ dốc CVD và xung tick
- Tùy chọn đặt lại CVD: Không bao giờ, Hàng ngày, hoặc theo Phiên
- Phát hiện phân kỳ Delta tăng và giảm
- Phát hiện phân kỳ CVD tăng và giảm
- Phát hiện hấp thụ để nhận biết áp lực không làm giá di chuyển
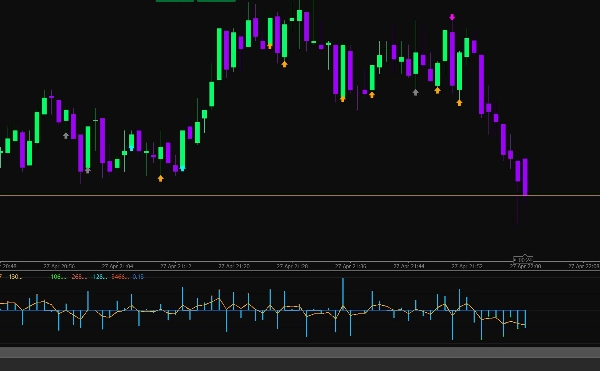
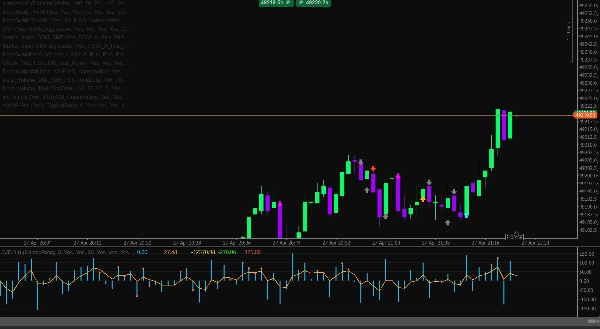
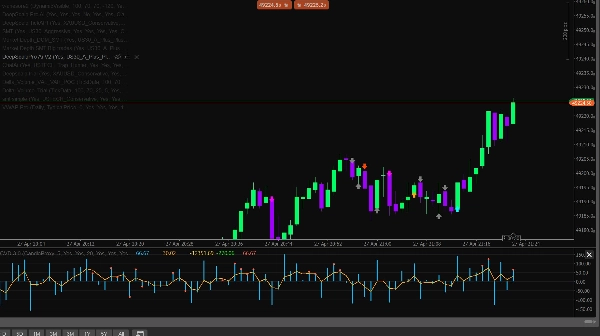
- Mũi tên tín hiệu cho cơ hội MUA và BÁN
- Mũi tên dự đoán cảnh báo thay đổi động lượng sớm
- Tùy chọn xác nhận CVD cho các tín hiệu
- Động cơ hội tụ thông minh với điểm số định hướng
- Bộ lọc áp lực đại diện DOM
- Bộ lọc phát hiện quét để bắt thanh khoản
- Bộ lọc phiên cho Châu Á, London và New York
- Phát hiện phiên tự động sử dụng giờ UTC
- Bảo vệ biến động sử dụng giới hạn ATR
- Bảo vệ spread để tránh điều kiện thị trường kém
- Bộ lọc tỷ lệ khối lượng để tránh tín hiệu yếu với khối lượng thấp
- Cài đặt sẵn ký hiệu cho Forex, Vàng, Chỉ số, Tiền điện tử và Dầu
- Mẫu chiến lược cho US30 M1, USTECH M1, XAUUSD M1, BTCUSD M1 và Dầu M1
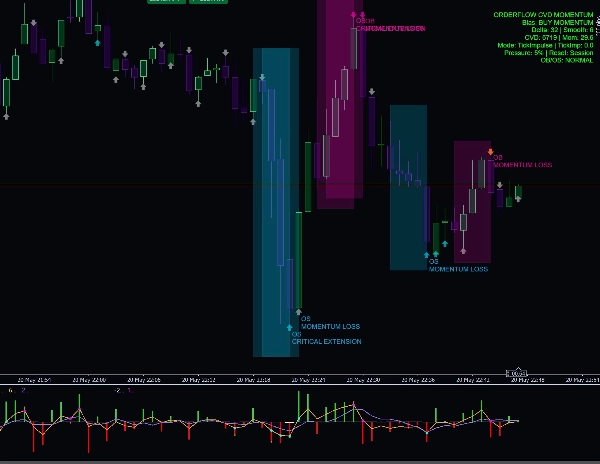
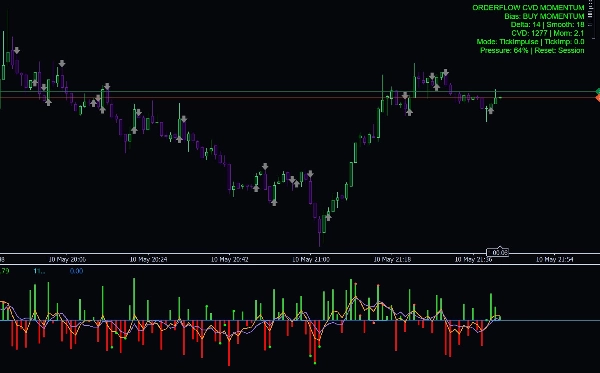
- Bảng điều khiển thông tin hiển thị xu hướng, Delta, Delta làm mượt, CVD, Động lượng, phần trăm áp lực và chế độ đặt lại
- Cảnh báo nhật ký tùy chọn với kiểm soát thời gian chờ
Tại Sao Các Nhà Giao Dịch Sử Dụng Nó
Delta CVD Advanced giúp các nhà giao dịch hiểu ai đang kiểm soát hiện tại: người mua hay người bán. Thay vì chỉ dựa vào nến giá, chỉ báo phân tích áp lực đằng sau chuyển động. Điều này làm cho nó hữu ích trong việc xác nhận điểm vào, tránh tín hiệu yếu, nhận diện đảo chiều, phát hiện hấp thụ và phát hiện thay đổi động lượng trước khi chúng trở nên rõ ràng trên giá.
Chế độ động lượng tick đặc biệt hữu ích cho việc lướt sóng trực tiếp vì nó phản ứng với xung giá thời gian thực, trong khi các công cụ CVD và delta làm mượt giúp xác nhận xem chuyển động có sức mạnh thực sự đằng sau hay không.
Phù Hợp Nhất Cho
- Lướt sóng
- Giao dịch trong ngày
- Xác nhận động lượng
- Xác nhận đảo chiều
- Phân tích quét thanh khoản
- Giao dịch phân kỳ Delta và CVD
- Vàng, Chỉ số, Tiền điện tử, Dầu và các cặp Forex
- M1, M5 và các khung thời gian thấp hơn khác
Lưu Ý Quan Trọng
Chỉ báo này là một công cụ hỗ trợ quyết định phân tích. Nó không đảm bảo lợi nhuận và nên được sử dụng cùng với quản lý rủi ro phù hợp, cấu trúc thị trường và kế hoạch giao dịch đã được kiểm tra.
Tóm tắt
Additional functionalities include detection of bullish and bearish Delta and CVD divergences, absorption detection to identify pressure that fails to move price, and signal arrows for buy/sell opportunities alongside prediction arrows for early momentum shifts. It incorporates session filters for Asia, London, and New York trading sessions, volatility and spread guards, volume ratio filters, and a smart confluence engine with directional scoring.
CVD Ai supports markets such as Forex, Gold, Indices, Crypto, and Oil, and is optimized for scalping, intraday trading, and short-term momentum confirmation on lower timeframes like M1 and M5. It offers strategy templates for specific symbols including US30, USTECH, XAUUSD, BTCUSD, and Oil. The indicator includes an info dashboard displaying bias, Delta, smoothed Delta, CVD, momentum, pressure percentage, and reset mode options.
Đánh giá của khách hàng
5 | 0 % | |
4 | 100 % | |
3 | 0 % | |
2 | 0 % | |
1 | 0 % |


