
support and resistance
Chỉ báo
13 lượt mua
Phiên bản 1.0, Jun 2025
Windows, Mac
4.3
Đánh giá: 3
Tính năng chính:
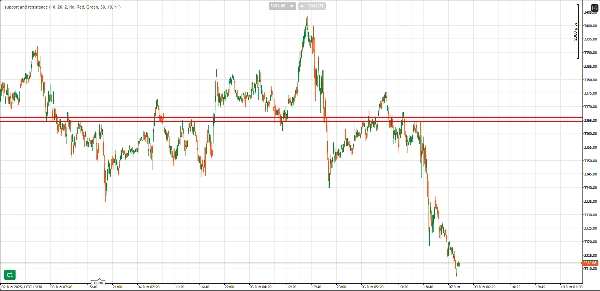
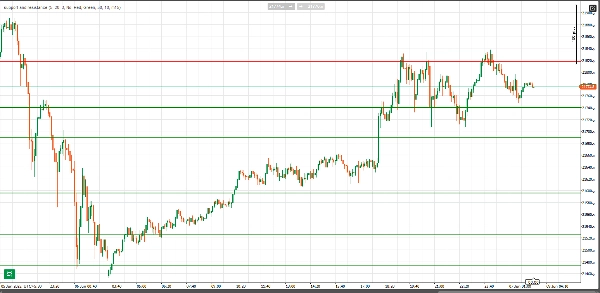
- Phát hiện tự động các mức hỗ trợ và kháng cự: Chỉ báo tự động xác định các mức hỗ trợ và kháng cự quan trọng dựa trên hành động giá, làm nổi bật các vùng mà giá đã đảo chiều hoặc dừng lại nhiều lần.
- Xác thực số lần bật lại: Các mức hỗ trợ và kháng cự được xác thực dựa trên số lần bật lại (phản ứng giá) từ mức đó. Số lần bật lại càng nhiều, mức đó càng mạnh. Bạn có thể điều chỉnh số lần bật lại tối thiểu để một mức được coi là hợp lệ, đảm bảo chỉ những mức quan trọng cao mới được đánh dấu.
- Kiểu đường có thể điều chỉnh: Độ dày và kiểu của các đường hỗ trợ và kháng cự được tự động điều chỉnh dựa trên số lần bật lại. Các mức có nhiều lần bật lại hơn được vẽ bằng đường dày hơn, nổi bật hơn, nhấn mạnh tầm quan trọng của chúng.
- Chiều rộng vùng (Pips): Bạn có thể định nghĩa một vùng đệm quanh các mức hỗ trợ và kháng cự bằng pips. Điều này giúp xác định hành động giá trong phạm vi mà giá có thể đảo chiều hoặc phản ứng.
- Bộ lọc khung thời gian cao hơn: Một tính năng độc đáo của chỉ báo này là khả năng xác thực các mức hỗ trợ và kháng cự bằng bộ lọc khung thời gian cao hơn. Bằng cách chọn một khung thời gian cao hơn (ví dụ: 1H, 4H), chỉ báo sẽ kiểm tra chéo các mức đã xác định với hành động giá quan trọng trên khung thời gian cao hơn, đảm bảo chỉ những mức quan trọng mới được vẽ trên biểu đồ.
- Cảnh báo: Khi giá vào vùng của một mức hỗ trợ hoặc kháng cự, chỉ báo có thể cảnh báo bạn bằng âm thanh, giúp bạn không bỏ lỡ phản ứng giá quan trọng.
- Màu sắc tùy chỉnh: Bạn có thể dễ dàng thay đổi màu sắc của các đường hỗ trợ và kháng cự để phù hợp với sở thích hoặc chủ đề giao dịch của bạn.
- Ngăn chặn chồng chéo: Chỉ báo bao gồm một bộ lọc ngưỡng giúp ngăn việc vẽ các mức hỗ trợ và kháng cự chồng chéo quá gần nhau, đảm bảo chỉ những mức duy nhất và quan trọng được hiển thị.
Lợi ích:
- Tiết kiệm thời gian: Tự động phát hiện và hiển thị các mức hỗ trợ và kháng cự chính mà không cần vẽ thủ công.
- Hình ảnh rõ ràng: Dễ dàng nhận biết các mức hỗ trợ và kháng cự quan trọng nhất dựa trên số lần bật lại và xác thực khung thời gian cao hơn.
- Cảnh báo hiệu quả: Nhận cảnh báo kịp thời khi hành động giá vào các mức quan trọng, giúp bạn hành động nhanh chóng và hiệu quả.
- Quyết định giao dịch cải thiện: Sử dụng chỉ báo này để tăng sự tự tin trong việc vào và thoát lệnh cũng như phân tích kỹ thuật tổng thể của bạn.
Tùy chọn tùy chỉnh:
- Số thanh nhìn lại: Điều chỉnh khoảng thời gian mà chỉ báo xem xét để xác định các mức hỗ trợ và kháng cự tiềm năng.
- Số lần bật lại tối thiểu: Đặt số lần bật lại tối thiểu cần thiết để một mức được coi là hợp lệ.
- Khung thời gian cao hơn: Lọc các mức hỗ trợ và kháng cự dựa trên khung thời gian cao hơn (ví dụ: biểu đồ 1 giờ, 4 giờ).
- Màu đường: Chọn màu cho các đường kháng cự và hỗ trợ phù hợp với phong cách biểu đồ của bạn.
- Cài đặt cảnh báo: Bật hoặc tắt cảnh báo dựa trên việc giá vào các vùng hỗ trợ hoặc kháng cự.
Hồ sơ chỉ báo
Danh mục chỉ báo
Hỗ trợ & kháng cự
Loại đầu ra
Hình ảnh trực quan
Yêu cầu dữ liệu
Chỉ dữ liệu nến
Tín hiệu được hỗ trợ
Phá vỡ giá
Đảo chiều
4.3
Đánh giá: 3
5 | 33 % | |
4 | 67 % | |
3 | 0 % | |
2 | 0 % | |
1 | 0 % |
Đánh giá của khách hàng
June 11, 2025
Nice setup companion for a more controlled workflow. It helps with planning entries and exits around important areas, but not every zone holds, even if it looks clean. The cleanest use is 3 to 5 levels per chart, with 0.5 pullbacks checked before entry. I would still keep manual review in the process.
June 10, 2025
June 10, 2025
Decent option for checks around key price zones. The useful part is planning entries and exits around important areas, with the numbers checked before scaling. I would wait for 2 reactions and avoid trades where the target is less than 1.5R. Levels are useful when they reduce noise, not when they crowd the chart.
BTCUSD
Prop
Forex
Breakout
Indices
EURUSD
Commodities
GBPUSD
NZDUSD
XAUUSD
NAS100
USDJPY
Các sản phẩm có sẵn trên cTrader Store, bao gồm bot giao dịch, chỉ báo và plugin, được cung cấp bởi các nhà phát triển bên thứ ba và chỉ nhằm mục đích cung cấp thông tin và tiếp cận kỹ thuật. cTrader Store không phải là nhà môi giới và không cung cấp lời khuyên đầu tư, khuyến nghị cá nhân hay bất kỳ đảm bảo nào về hiệu suất trong tương lai.


Kể từ 30/05/2025
40
Lượt bán