
الوصف
📈 PineScriptLabs إشارات ذكية CDRC [TP/SL تلقائي]
❓ ما هو هذا المؤشر؟
نظام قنوات النطاق الإغلاق الديناميكية (CDRC) هو مؤشر تم تطويره تحت نظرية PineScriptLabs يستخدم قناتين مستقلتين لتوليد إشارات شراء/بيع 📊 و حساب أهداف الربح الديناميكية (TP) ووقف الخسارة (SL) تلقائيًا 🎯 التي لا تكون أبدًا متشابهة.
🎯 خوارزمية TP/SL ديناميكية خاصة ⚡
على عكس الأنظمة التي تستخدم مستويات ثابتة أو ATR، تحسب هذه الخوارزمية TP و SL بناءً على حركة السعر الفعلية من آخر إشارة:
• لـ LONG 📈: تقيس المسافة من أدنى سعر مسجل إلى نقطة الدخول، وتحسب نسبة تلك الحركة، وتُسقط نفس النسبة صعودًا لتحديد الأهداف
• لـ SHORT 📉: تقيس المسافة من أعلى سعر مسجل إلى نقطة الدخول، وتُسقط تلك النسبة هبوطًا
🎯 هذا يعني أن كل صفقة لها مستويات فريدة متكيفة مع سياق السوق المحدد في تلك اللحظة، تعكس الزخم الحقيقي قبل الإشارة 💡
📊 نظرية CDRC: بناء القناة 🏗️
الأساس الفني 🔍
تبني نظرية CDRC القنوات استنادًا حصريًا إلى نطاقات أسعار الإغلاق، وليس على التقلب أو الانحراف المعياري. الإغلاقات تمثل إجماع السوق الحقيقي وتزيل ضوضاء الفتيل 🎯
عملية البناء ⚙️
- السعر المتوسط: متوسط جميع إغلاقات الفترة
- النطاق: الفرق بين أعلى وأدنى إغلاق في الفترة
- السعة: النطاق × المضاعف ÷ 2
- الأشرطة:
o الأعلى = السعر المتوسط + السعة ↗️
o الأدنى = السعر المتوسط - السعة ↘️
🔄 يتم إعادة حساب القنوات عند كل شريط، متكيفة باستمرار مع السوق
⚙️ كيف يعمل؟
قناتان متزامنتان 📊📊
• القناة 1 (سريعة - 111 شريط): تستجيب بسرعة للتغيرات، المضاعف 0.14 ⚡
• القناة 2 (بطيئة - 388 شريط): رؤية طويلة الأمد، المضاعف 0.11 🐢
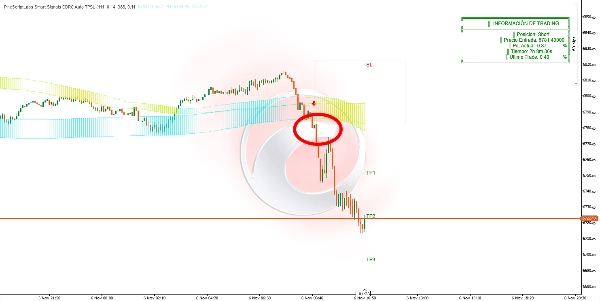
توليد الإشارة 🎯
• LONG ✅: يغلق السعر فوق الشريط العلوي لـ كلا القناتين لمدة شريطين متتاليين 🟢
• SHORT ✅: يغلق السعر تحت الشريط السفلي لـ كلا القناتين لمدة شريطين متتاليين 🔴
🛡️ التأكيد المزدوج يفلتر الإشارات الخاطئة
🤖 حساب TP/SL تلقائي (تفاصيل الخوارزمية)
لـ LONG 📈:
- يسجل النظام باستمرار أدنى سعر منذ آخر إشارة
- عند توليد إشارة شراء، يحسب: النسبة = (الدخول - الحد الأدنى) / الدخول × 100
- يسقط تلك النسبة صعودًا من نقطة الدخول لتحديد TP3
- يقسم النطاق إلى ثلاث مناطق: TP1 (33%)، TP2 (66%)، TP3 (100%)
- SL = الدخول - (الدخول × النسبة × نسبة وقف الخسارة / 100)
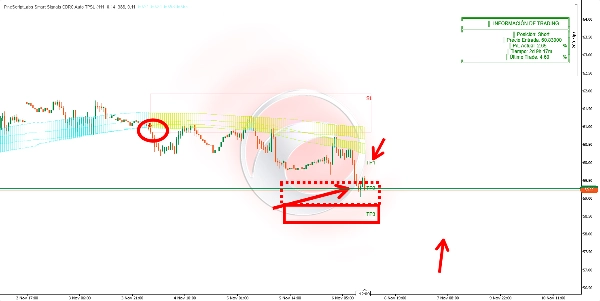
لـ SHORT 📉:
- يسجل النظام باستمرار أعلى سعر منذ آخر إشارة
- عند توليد إشارة بيع، يحسب: النسبة = (الحد الأقصى - الدخول) / الدخول × 100
- يسقط تلك النسبة هبوطًا من نقطة الدخول لتحديد TP3
- يقسم النطاق إلى ثلاث مناطق تصاعدية
- SL = الدخول + (الدخول × النسبة × نسبة وقف الخسارة / 100)
🎯 النتيجة: كل صفقة لها مستويات فريدة محسوبة وفقًا للزخم السوقي المحدد في تلك اللحظة
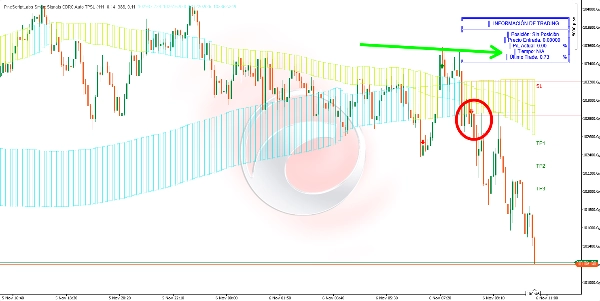
👀 التصور 🎨
• النقاط: أشرطة كلا القناتين
• التعبئة الديناميكية: القنوات تغير اللون عند الاختراق
• الصناديق: منطقة الدخول (SL-الدخول) وثلاث مناطق هدف (تدرجات شفافة تصاعدية)
• العلامات: SL، TP1، TP2، TP3 مع الأسعار الدقيقة 🏷️
• الأسهم: أخضر (شراء) 🟢 / أحمر (بيع) 🔴
• الجدول: الوضع الحالي، سعر الدخول، نسبة الربح/الخسارة الحالية، الوقت في الصفقة، آخر صفقة مغلقة 📋
🎯 ما الغرض منه؟
- دخول عالي الاحتمالية بتأكيد إطار زمني مزدوج ✅
- إدارة مخاطر تلقائية متكيفة استنادًا إلى حركة السوق الفعلية 🤖
- أهداف متدرجة فريدة لكل صفقة وفقًا للزخم السابق 🎯
- تكيف ديناميكي مع سلوك السعر الأخير 🔄
- مراقبة في الوقت الحقيقي لأداء الوضع 📊
🛠️ كيفية استخدامه؟
الدخول 🚀: ادخل عند إغلاق الشريط عندما تظهر السهم
الإدارة 💼:
• TP1: 33% من الحركة المتوقعة (أرباح جزئية) 💰
• TP2: 66% من الحركة (مزيد من الأرباح) 💰💰
• TP3: 100% من الحركة (الهدف النهائي) 🎯
• SL: احترم دائمًا وقف الخسارة التلقائي ⛔
المراقبة 👀: يعرض الجدول الربح/الخسارة الحالي في الوقت الحقيقي. يكتشف النظام تلقائيًا عند الوصول إلى TP3 أو SL. إشارة واحدة نشطة فقط في كل مرة ⚠️
⚙️ المعلمات والتأثير
فترة القناة 1 (111):
• ↑ المزيد من الأشرطة = إشارات أقل، أكثر موثوقية، أبطأ 🐢
• ↓ عدد أقل من الأشرطة = إشارات أكثر، أسرع، أكثر حساسية ⚡
مضاعف القناة 1 (0.14):
• ↑ أعلى = أشرطة واسعة، إشارات أقل، فقط الحركات القوية 💪
• ↓ أقل = أشرطة ضيقة، إشارات أكثر، حساسية أكبر 🎯
فترة القناة 2 (388):
• ↑ أعلى = تأكيد صارم، إشارات أقل 🛡️
• ↓ أقل = إشارات أكثر، فلترة أقل 📊
مضاعف القناة 2 (0.11):
• ↑ أعلى = فلترة صارمة، محافظ 🎯
• ↓ أقل = حساسية أعلى، صفقات أكثر ⚡
نسبة وقف الخسارة (50%):
• 50% = نسبة 1:2 (توازن احترافي: مخاطرة 1، ربح 2) ⚖️
• ↑ نحو 100% = SL واسع، مخاطرة أكبر، توقفات أقل، نسبة ربح/مخاطرة أسوأ 📉
• ↓ نحو 1% = SL ضيق، مخاطرة أقل، نسبة ربح/مخاطرة أفضل، توقفات أكثر 📈
🔑 الاعتبارات الرئيسية
• ذاكرة السوق 🧠: تسجل أقصى وأدنى الأسعار منذ آخر إشارة لإسقاطات واقعية وفريدة
• TP/SL لا تتساوى أبدًا ⚖️: كل صفقة لها مستويات محسوبة وفقًا لسياقها الخاص
• تأكيد مزدوج إلزامي لمدة شريطين متتاليين ✅✅
• إشارة واحدة نشطة فقط في كل مرة ⚠️
• القنوات تعيد الحساب باستمرار متكيفة مع السوق 🔄
• الصناديق تمتد بصريًا للحفاظ على الرؤية 👀
🚀 أكثر من 10,000 متداول يستخدمون بالفعل أفضل مؤشراتنا🏆
👉 احصل على جميع أنظمتنا الأفضل هنا:
_______________________________________________
📌 مؤشرات هيكل السوق
· ✅ هيكل السوق المتقدم: Bos، Choch، SwinLevels، كتل الأوامر، هيكل السوقوآداة إيجاد السيولة
· 🔄 تحليل هيكل السوق الديناميكي لنقاط التحول
· 🧱 كتلة الأوامر
· ⚖️ اختلال السوق
· ⛓️ BOS & CHOCH
· 🧠 قوة ICT من 3
_______________________________________________
🔚 أنظمة الخروج الذكية
_______________________________________________
📐 مؤشرات ZigZag
· 🧭 هيكل S&R ZigZag
· ➖ ZigZag
_______________________________________________
🧱 مؤشرات الدعم والمقاومة
· 🟩 خطوط دعم ومقاومة SmartTrend
· 🧱 جميع مستويات الدعم والمقاومة
_______________________________________________
📊 مؤشرات الاتجاه والقناة
· 📊 سوبرتريند
· ⭐ قناة SSL المميزة
_______________________________________________
💧 أدوات الحجم والسيولة
· 📉 خريطة تصفية الرافعة المالية
_______________________________________________
⚡ مؤشرات الزخم و RSI
· 📈 مُشغل اتجاه RSI
· 🔎 متتبع تحيز الشمعة متعدد المستويات
Tracker
_______________________________________________
🔮 أدوات التنبؤ والإسقاط
· 📐 التنبؤ بناءً على Linreg و ATR
· 📏 انحدار خطي فيبوناتشي متعدد الأطر الزمنية
· 📈 عارض تدفق السوق المدعوم بالحجم
الملخص
تقييمات العملاء
5 | 67 % | |
4 | 0 % | |
3 | 33 % | |
2 | 0 % | |
1 | 0 % |


