
説明
Pinescriptlabs ストアインジケーター: Pinescriptlabs ストア cBots : (cBot) Gold & BTC BreakoutSession Pivots(new)
PRICE ACTION (New)
Prediction Based on Linreg & ATR
SmartTrend Support &
Resistance
Lines
Dynamic
Market Structure
Analysis
of
Turning
Points
Fibonacci
Linear
Regression
Multi-timeframe
Multi-Level
Candle Bias
Tracker
Auto
Support and
Resistance
Trend
Lines
All
Support and
Resistance
Levels
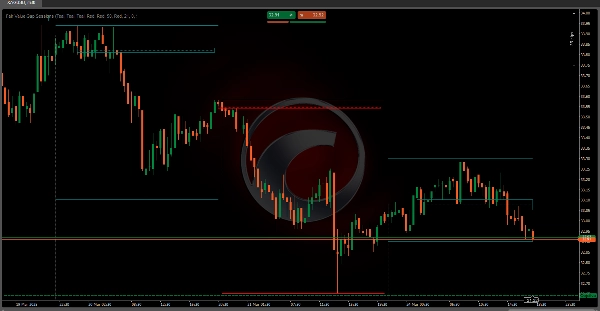
Fair Value Gap Sessions 📊💰
Fair Value Gap(FVG)インジケーターは、特定の取引セッション内で「フェアバリューギャップ」と呼ばれる一時的な市場の非効率性を特定し、強調表示するために設計された高度な取引ツールです🚨。これらのギャップは、市場価格が急速に動く瞬間⚡を表し、買い手と売り手の間に不均衡を生み出します。
主要な技術的メカニズム 🔧
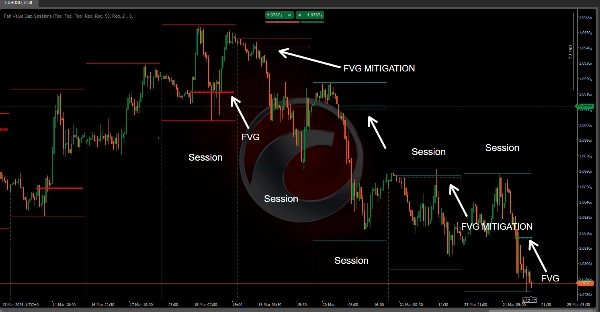
セッションベースのアーキテクチャ 🕒
• 正確で設定可能なセッションベースの分析アプローチを実装
• トレーダーがUTCまたはローカルタイムゾーンのサポートでカスタムセッション開始時間を定義可能 🌍
• 市場の動向をリセットし追跡する動的なセッション境界を作成 🔄
フェアバリューギャップ検出ロジック 🔎
• 複数の連続する価格バーにわたる高度な価格アクション分析を使用
• 以下を比較してギャップを特定:
o 連続するバーの高値と安値の価格 📈📉
o 前のバーの終値 ✅
o 現在のバーの価格構造 🔄
ギャップ分類 🏷️
インジケーターは主に2つのギャップタイプを区別します:
- 強気のフェアバリューギャップ 📈
o 価格が前の高値を上回ったときに発生 🔺
o 上昇の市場モメンタムの可能性を示唆 🚀
o 買い圧力の可能性を示すシグナル 💸 - 弱気のフェアバリューギャップ 📉
o 価格が前の安値を下回ったときに発生 🔻
o 下降の市場モメンタムの可能性を示唆 ⬇️
o 売り圧力の可能性を示すシグナル 🛑
取引への応用 📱💼
戦略的洞察 💡
• トレーダーが市場の非効率性を視覚化するのに役立つ 🖼️
• 潜在的なトレンド反転の早期警告を提供 ⚠️
• 正確なエントリーおよびエグジットポイントの特定を提供 🎯
リスク管理機能 🛡️
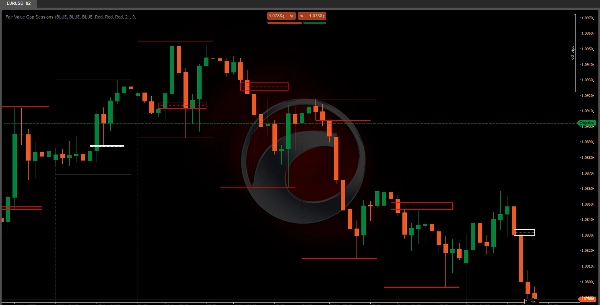
• ギャップ状態の色分けされた視覚化 🎨
• ギャップ「緩和」(価格がギャップゾーンに戻るとき)を追跡 ↔️
• 異なる市場状況に応じたカスタマイズ可能な色設定を許可 🎨
技術的視覚化 🎨
インジケーターは主に2つの視覚要素を作成します:
- ギャップエリア長方形 🟩
o 特定されたギャップの価格範囲を表す 📐
o 取引セッション全体にわたって動的に拡張 ➡️
o ギャップ状態(アクティブ/緩和)に基づいて色が変わる 🟩➡️🟨 - レベルライン 📏
o ギャップの中間点に配置 ⚫
o トレーダーがギャップの中心価格ゾーンを迅速に特定するのに役立つ 📍
o ギャップ状態を示すために異なるラインスタイルを使用 ➔
実用的な取引戦略 📝
エントリーシグナル戦略 🚦
• ギャップ検出を潜在的なトレンド継続シグナルとして使用 🔄
• ギャップに価格が戻る(緩和する)ことを確認として探す ✅
• 他の技術指標と組み合わせて堅牢な意思決定を行う 🤝
リスク管理技術 🛡️
• ギャップ境界付近にストップロスを設定 ⛔
• ギャップの中間点を潜在的なサポート/レジスタンスレベルとして使用 🪜
• ギャップ緩和を潜在的なトレンド反転の指標として監視 ↔️⚠️
設定の柔軟性 ⚙️
• カスタマイズ可能なセッション開始時間 ⏰
• タイムゾーン設定(UTC/ローカル) 🌍
Fair Value Gap Sessions インジケーターを理解し適切に実装することで、トレーダーは市場のダイナミクスをより深く洞察し、潜在的な取引機会を特定し、価格アクションの非効率性に基づいたより情報に基づく意思決定を行うことができます。 🧠📈
概要
It classifies gaps into two types: bullish gaps, indicating potential upward momentum and buying pressure, and bearish gaps, signaling possible downward momentum and selling pressure. Visually, it represents gaps with dynamic rectangles showing the price range and a midpoint level line to help traders quickly locate the gap's central price zone. Colors and line styles change to reflect the gap's active or mitigated status.
Traders can use this tool to visualize market inefficiencies, receive early warnings of trend reversals, and identify precise entry and exit points. Risk management features include color-coded gap states, tracking of gap mitigation when price returns to the gap zone, and customizable color settings. The indicator supports practical strategies such as using gap detection for trend continuation signals and combining it with other indicators for decision-making. Stop-loss placement near gap boundaries and monitoring gap mitigation for trend reversal are also supported.
カスタマーレビュー
5 | 100 % | |
4 | 0 % | |
3 | 0 % | |
2 | 0 % | |
1 | 0 % |


![「[Stellar Strategies] Visual Trend Momentum」ロゴ](https://cdn.ctrader.com/image/webp/48aee0a5-f10e-4bc8-9671-78e156fcc5df_27548)