present
新規登録で初回購入時に$50オフ
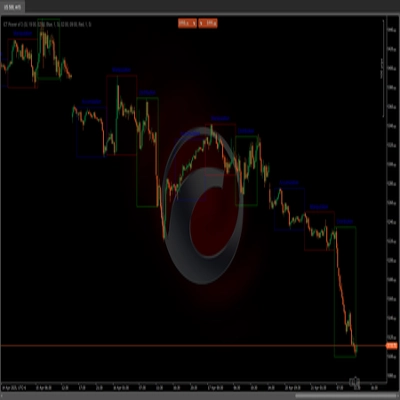
Trading product for Supertrend インジケーター BTCUSD Breakout, image 1
Supertrend
4.3
レビュー: 3
登録日 03/10/2024
178
販売
45.63K
無料インストール

説明

Pinescriptlabs ストアのインジケーター:                        Pinescriptlabs  ストア cBots :  (cBot) Gold & BTC ブレイクアウトセッションピボット(新着)

プライスアクション  (新着)

トレーリングスマートアルゴリズム (新着)

S&R 構造的ジグザグ                                

ジグザグ

 BOS & CHOCH

ゾーンサプライデマンド

レバレッジ清算マップ

オートトレンドチャネル


ボリュームPOCヒートマップ


プレミアムSSLチャネル

Linreg & ATR に基づく予測

 ICT パワーオブ3 
                                                   

スマートトレンドサポート &
レジスタンス
ライン
       

フェアバリューギャップセッション                


RSIトレンドトリガー

チャネルブレイクアウトシステム

スーパートレンド

マーケットアンバランス

アダプティブトレンドチャネル 

ダイナミック
マーケット構造
分析
の
転換点
ポイント

オーダーブロック

フィボナッチ
線形
回帰
マルチタイムフレーム

ダイナミックRSI

モメンタムフェアバリューギャップ

マーケットフロープロジェクション

ダイナミックトレンドグラデーション

マルチレベル
キャンドルバイアス
トラッカー

ジグザグ極端トラッカー

リアクティブ移動平均

オート
サポートと
レジスタンス
トレンド
ライン

すべての
サポートと
レジスタンス
レベル

ダイナミックレンジモメンタム

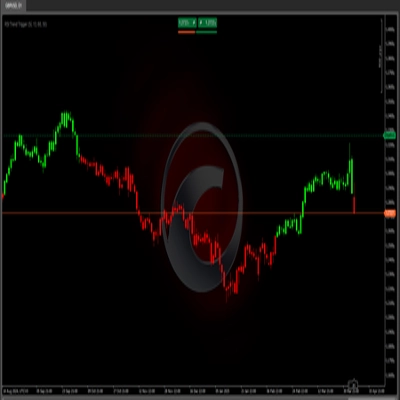
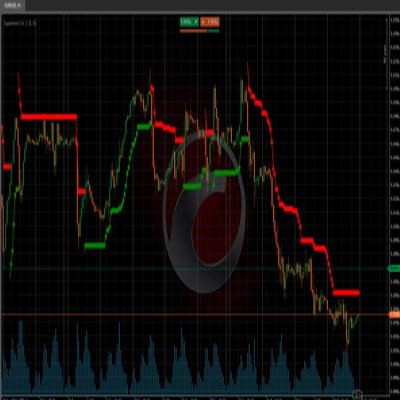
🚀 **トレンドフォローアルゴリズム** は、**平均真の範囲 (ATR)** 📊 を活用して価格チャネル 📈 を定義し、トレンドの方向(強気 🟢 または 弱気 🔴)を判断します。インジケーターはトレンドに基づいて色を変え、ラインを描画するため、市場のモメンタムの変化を視覚的に捉えやすくします。 💹


### 🔧 **入力パラメータ**:


1. **ATR期間** ⏳:

- **平均真の範囲** を計算する期間数を定義します。これはインジケーターの感度に影響し、市場の動きをより速くまたは遅く捉えるのに役立ちます。


2. **ATR乗数** 🔍:

- 市場のボラティリティ 🌊 に基づいてトレンドライン間の距離 📉 を調整します。値が大きいほどチャネルが広がり、誤ったシグナルを減らしつつ主要な市場の動きをより明確に示します。 📐


概要

AIによる概要
The Supertrend indicator is a trend-following tool that uses the Average True Range (ATR) to define a dynamic price channel and identify market trend direction as bullish or bearish. It visually represents trend shifts by changing colors and drawing lines on the price chart, facilitating the recognition of momentum changes. Key adjustable inputs include the ATR Periods, which set the number of periods for ATR calculation affecting sensitivity, and the ATR Multiplier, which adjusts the channel width based on market volatility to balance signal accuracy and noise reduction. This indicator supports analysis across various markets including cryptocurrencies (e.g., BTCUSD), commodities (e.g., gold, XAUUSD), and others. It is designed to help traders visualize and follow prevailing trends by providing clear, adaptive trend signals derived from price action and volatility measures.
インジケーターのプロフィール

ディスカッション

カスタマーレビュー

4.3
レビュー: 3
5
33 %
4
67 %
3
0 %
2
0 %
1
0 %
カスタマーレビュー
October 6, 2024
Useful in the right hands if the trader wants it helps keep attention on the broader move. It works best as support, not a final decision maker. I would judge the trend read across 3 sessions, with at least 2 higher timeframe candles agreeing. sideways markets can weaken the signal.
October 5, 2024
October 5, 2024
Solid option for review for traders who prefer directional setups. It gives value around trend filtering, but sideways markets can weaken the signal. The signal feels safer when trend strength is clear and DD stays under 3 percent. It is a filter for bias, not a reason to ignore risk.

よくあるご質問

BTCUSD
Breakout
Supertrend
Commodities
RSI
Crypto
XAUUSD
ATR
cTrader Storeで入手可能な取引ボット、インジケーター、プラグインなどの商品は、第三者の開発者が提供するものであり、情報と技術の取得のみを目的としてご利用いただけます。cTrader Storeはブローカーではなく、投資助言や個人的な推奨を行うことも、将来のパフォーマンスを保証することもありません。
この作成者の他の商品

「ZigZag」ロゴ
4.3
(6)
無料
ZigZag filters noise, spots trends, patterns, pivots, aiding analysis, trade management, and confirmations. 📉📈
📊 Shows volume by price levels, highlights POC, and key zones. Identifies dynamic support/resistance and imbalances.
Adaptive trend channel using linear regression and Pearson correlation for dynamic support, resistance, and trends.
identify and highlight temporary market inefficiencies known as "fair value gaps" 🚨 within specific trading Sessions.
📊Zones Supply & Demand: Identifies key price levels with high volume concentration, marking Supply/Demand Zones & Marke
🔍 Automatically detect support and resistance levels based on "swings" or pivots
🎯 Auto-plots key zones (Accumulation, Manipulation, Distribution) . Reveals institutional traps & trends.
RSI Trend Trigger 📈: Uses dual-layer RSI to spot trends & generate clear buy/sell signals.
Price action to detect when the market changes trend (MSB) and defines, order blocks , ZigZag etc.📊
Auto Supply and Demand Automatically identifies the zones of highest trading activity on your chart. 📊
Price direction by calculating the probability of reaching new highs/lows. Shows levels & stats📈
Combining Fibonacci levels and regression to analyze multidimensional market trends across multiple timeframes¡

これも好きかも

RSI, MACD, Stochastic, CCI & Momentum divergence scanner with confluence scoring. Never miss a signal again!
「Swing Points」ロゴ
4.5
(6)
$19
Multi-Timeframe Swing Points Indicator for cTrader that identifies swing highs and lows on both the current timeframe.
Smart Support/Resistance lines auto calculated from D1/H4/H1/M15. Highly customizable visuals + built in Backtest Mode.
ZLSMA: Zero-lag trend indicator! Catch trends fast with customizable settings. Boost your trading precision.
Algorithmic trend precision for cTrader.
RSI on the main chart with 45/55 momentum levels, overbought/oversold levels, averaged RSI, and multi-timeframe support.
VWAP Bands indicator with 3 standard deviation levels, buy/sell zones, and a draggable ON/OFF button to toggle the entir
「QX SmartStructure」ロゴ
4.7
(4)
$26
/
$50
SMC without the mess: Clean structure + auto-managing FVGs + MTF panel. Hard-right-edge, step size-based for any symbol.
Displays the previous day's, last week's, and last month's highest and lowest price levels on your chart.
Institutional Nasdaq Session Liquidity Map with Live Point HUD, Sweep Alerts & Interactive Playbook.
Boost your trading with Candlestick Patterns for cTrader – auto-detect key signals for smarter, faster decisions!
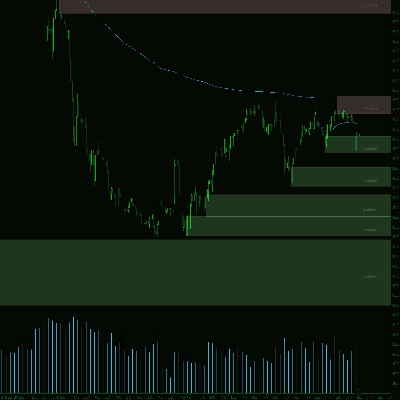
Liquidity Cluster Order automatically detects and draws accumulation zones & distribution zones
Auto-detect supply & demand zones, remove broken levels, and trade smarter with real-time alerts. Precision made simple.
Unlock the true intent of market participants with the Classic Proportional Cumulative Volume Delta CVD!
GOLD SENTINEL v1.0 - A CANDLE-COLORING INDICATOR FOR GOLD.
Stochastic Momentum Index (SMI) for cTrader optional higher-timeframe source, and clear overbought/oversold levels.
Fair Value Gaps with Multi-Timeframe.
Institutional Session Levels Pro OHLC,Prev(D,W,M OHLC)

価格

登録日 03/10/2024
178
販売
45.63K
無料インストール