

説明
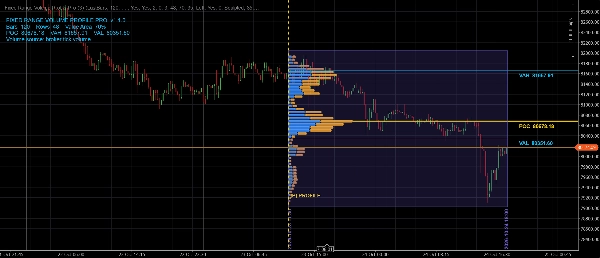
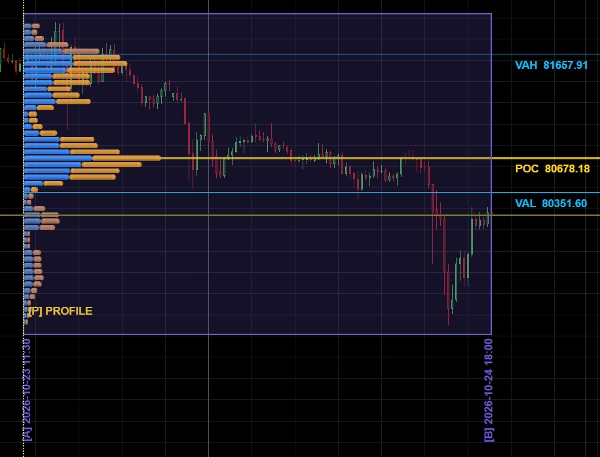
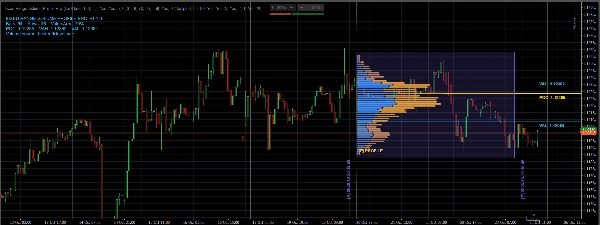
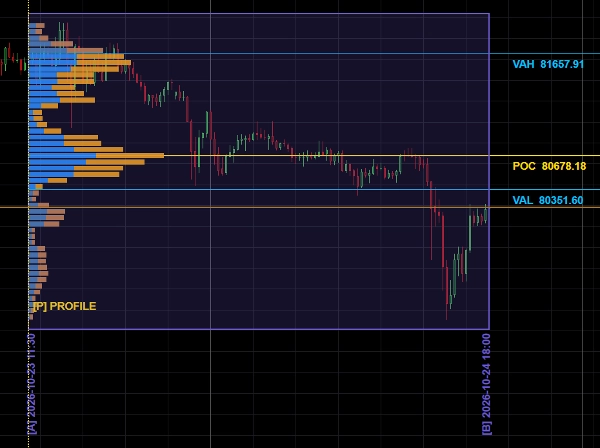
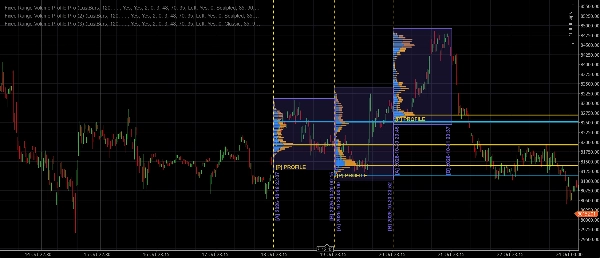
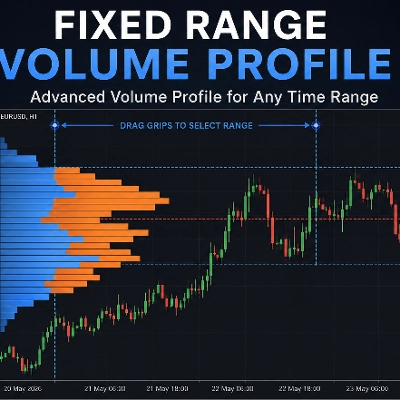
Fixed Range Volume Profile Pro maps broker tick volume across price levels within a selected time range. Move or resize the translucent range box directly on the chart. The sculpted, cylindrical-style histogram follows the box while retaining its relative position, and a separate pin lets you place the profile where it is easiest to read.
Key features
• Interactive range box with automatic price height and adjustable width
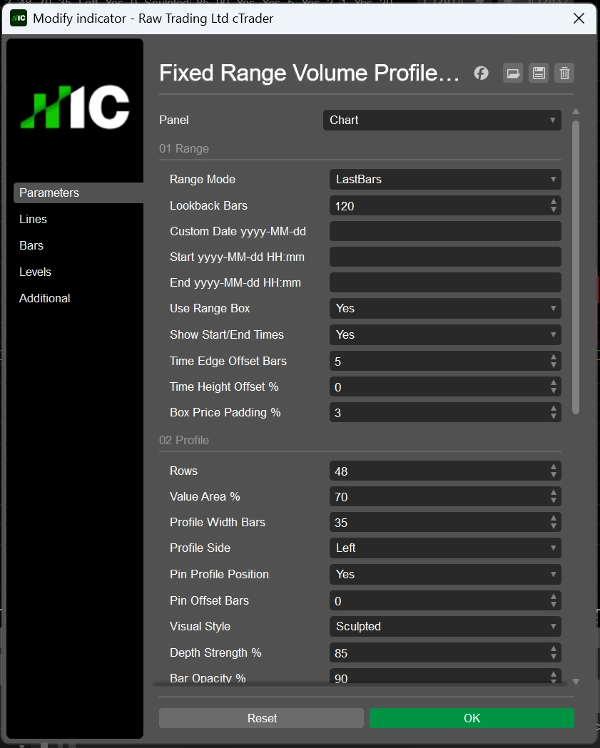
• Configurable number of price rows, profile width, colors, opacity and value-area percentage
• POC, Value Area High (VAH) and Value Area Low (VAL), with optional price labels and rightward extensions
• Estimated upward and downward volume coloring, with separate colors inside and outside the value area
• Last-bars, previous-day, custom-date and custom-date-time range modes
• Optional vertical start/end time labels with edge and height offsets
• Steady chart updates that reuse existing drawing objects
Designed for discretionary volume-profile and price-level analysis. It can be used on FX pairs, metals, indices, crypto and other symbols that provide tick-volume data in cTrader. For intraday analysis, start with liquid markets on M5–H1 charts; increase the lookback and adjust the rows for longer periods. The indicator does not place orders or generate guaranteed trade signals.
Data transparency: this is broker tick volume, not exchange-traded volume. Volume by price is estimated from each candle's body and wicks. Up/down coloring is an OHLC-based estimate, not true bid/ask delta or order flow. Values can differ between brokers and chart histories.
Compatibility: cTrader Desktop (Windows or Mac) 5.10 or later. Custom indicators are not available on cTrader Web or Mobile.
Trading involves risk. Past performance does not guarantee future results.
概要
ディスカッション
カスタマーレビュー
よくあるご質問
この作成者の他の商品




価格