

Trading product for DRXFootprint インジケーター Aggressive BOS, image 1
インジケーター
バージョン 1.0、Jul 2026
Windows、Mac
Trading product for DRXFootprint インジケーター Aggressive BOS, image 2
Trading product for DRXFootprint インジケーター Aggressive BOS, image 3
Trading product for DRXFootprint インジケーター Aggressive BOS, image 4
登録日 08/07/2026

説明

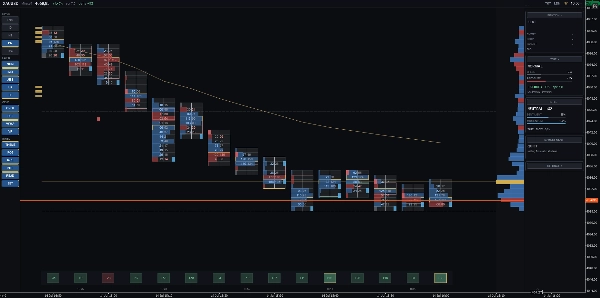
DRX OrderFlux turns the tick stream into an order flow chart: who is paying up,

where they are being stopped, and which levels the auction keeps coming back to.


WHAT IT DRAWS


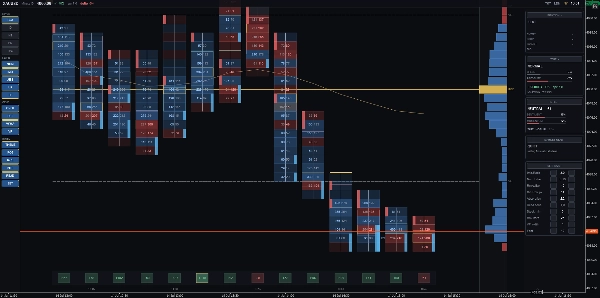
Bid x ask footprint. Every bar is split into price levels with buy and sell

activity side by side, so a bar is no longer one candle but the argument that

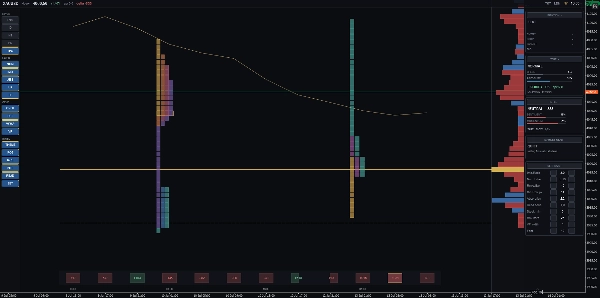
built it. Five views: Bid x Ask, Delta, Heatmap, Profile and TPO.


Imbalances and stacked walls. A level where one side is beaten by the ratio you

set is marked, and a run of them is labelled - stacked imbalances are where the

next move usually starts.


Absorption and unfinished auctions. Heavy activity that fails to move price, and

extremes that closed without being finished, are marked as they form.


Single prints. Levels the market touched once and left behind.


Volume profile in its own framed panel, pinned to the right edge with POC, VAH

and VAL, plus session VWAP.


TPO time blocks, one profile per session with its own POC, coloured warm to cool

across the day - so yesterday's shape stands beside today's and you can see

whether the auction has moved.


Delta lane along the foot of the chart, on one line so the bars can actually be

compared, with the loud ones outlined.


Market read. Deliberately quiet. It speaks only when price rejects a level it

cannot get through, or breaks one with volume, delta and range behind it. Every

threshold is a multiple of the instrument's own recent average, so gold and a

forex pair calibrate themselves - there is nothing to tune per symbol.


Tape panel. Speed of the tape against its own normal, buying against selling

pressure, and a liquidity warning when the book thins out and the spread widens.


Position panel. Entry, stop, target, PnL, pips and R:R - and the chart itself

gets three thin lines and nothing more. No candle is ever covered.


Your layout is remembered per symbol and timeframe, so the desk you build is the

desk you come back to.


HOW TO USE IT


Works on any symbol and any timeframe. It is at its best on the intraday charts

where order flow lives: M1 to H1 on gold, indices, oil and the major forex pairs.

Add DRX Footprint Lower underneath for volume, delta, cumulative delta or buy vs

sell flow in its own pane.


ABOUT THE DATA - PLEASE READ


cTrader tick data carries time, bid and ask. It does not carry trade size, and no

indicator on this platform can invent it. DRX OrderFlux therefore measures tick

activity, not traded contracts - the same basis MetaTrader order flow tools use on

forex and CFDs. It reads the balance of aggression honestly and it is genuinely

useful, but if you need exchange-traded contract volume, this is not that, and I

would rather tell you now than take your money.


Depth of market is a broker feed. Most cTrader CFD accounts publish only a few

aggregated levels, so no order book ladder is included - what the book does tell

us, a liquidity warning, is in the tape panel instead.


Trading involves risk. Past performance does not guarantee future results.

概要

インジケーターのプロフィール

カスタマーレビュー

0.0
レビュー: 0
カスタマーレビュー
この商品にはまだレビューがありません。お使いになったことがある方は、ぜひレビューをお願いします。

ディスカッション

よくあるご質問

Aggressive
BOS
Imbalance
Order Block
Volume
CHOCH
DOM Tools
cTrader Storeで入手可能な取引ボット、インジケーター、プラグインなどの商品は、第三者の開発者が提供するものであり、情報と技術の取得のみを目的としてご利用いただけます。cTrader Storeはブローカーではなく、投資助言や個人的な推奨を行うことも、将来のパフォーマンスを保証することもありません。

これも好きかも

インジケーター
AI
ATR
+27
VWAP Sniper Elite -- Institutional Trend Engine
インジケーター
CHOCH
Fair Value Gap
+2
Advanced FVG & IFVG indicator with multi-timeframe confluence, CHoCH filtering, and smart mitigation.
インジケーター
ATR
SMC
+7
SMC indicator for cTrader detecting order blocks, fair value gaps, liquidity sweeps and market structure with buy/sell
インジケーター
RSI
Breakout
+1
📊 Liquidation Map: Potential areas where highly leveraged investors might face liquidations.
インジケーター
AI
ATR
+26
The Triple Momentum indicator for cTrader is a versatile trend-following tool.
インジケーター
Forex
Crypto
+4
Statistical boundaries that adapt to real-time volatility for a better risk management.
インジケーター
Signal
New Trend whit buy-sell signal
「BvsB 2026」ロゴ
トップ評価
4.7
(4)
$100
インジケーター
Prop
Forex
+1
Smart support/resistance indicator with rejection-only Buy/Sell signals designed for H1 charts.
インジケーター
Forex
Crypto
+5
Experience a new approach with amplitude-based momentum analysis. Smart Trend Detection That Adapts to Market Volatility
インジケーター
AI-assisted
Predictive Monte Carlo Engine Forecast future price paths using institutional-grade statistical models and probability
インジケーター
ADX
ATR
+5
Adaptive Fibonacci trailing system with regime detection, confidence grading, R:R zones and a live stats dashboard.
インジケーター
SMC
Prop
+13
Tracks virgin levels. Lines vanish only after a candle closes beyond the high/low on your chosen timeframe.
インジケーター
ATR
RSI
+2
This indicator works best as a trend-confirmation tool—wait for multiple signals!
インジケーター
VWAP
Volume
+4
Advanced Order Flow & Volume Profiling for cTrader. Unveil institutional footprints, Delta, and Anchored VWAPs.
インジケーター
Forex
Indices
+1
Detects HTF bias using CRT, Expansion & Swing Point patterns with SMT/PSP divergence — visualised in a floating candle
インジケーター
Prop
Forex
+13
⚔️Full breakout trading workstation: session box, EP/TP/SL levels, on-chart ✓/✗ outcomes, pro-level analytics and more⚔️
インジケーター
AI
RSI
+19
The HAI Quantum V10 is an advanced indicator designed for technical analysis.
インジケーター
Key Levels
Order Block
+3
Professional indicator for automated detection and dynamic tracking of Supply & Demand zones in cTrader.

価格

登録日 08/07/2026

















