
Descripción
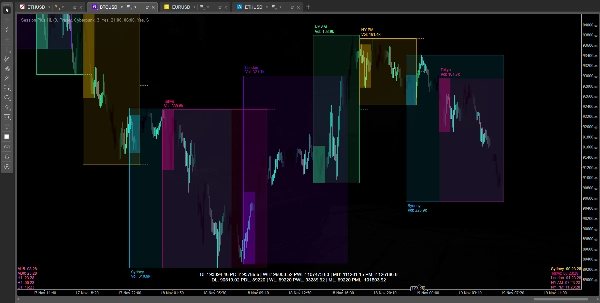
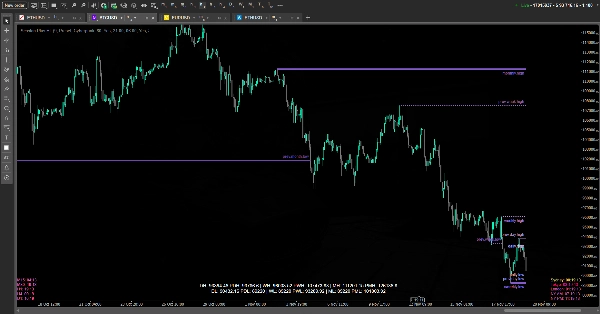
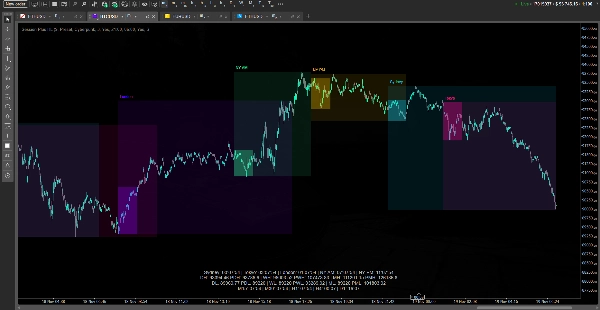
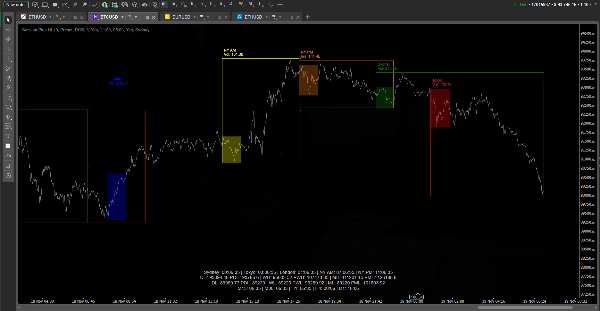
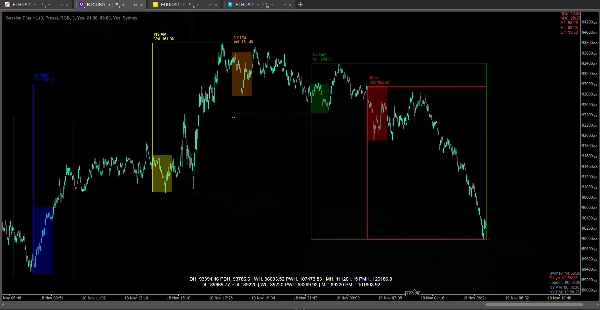
Este indicador está diseñado para visualizar la estructura del mercado y el contexto basado en el tiempo para los traders intradía. Traza automáticamente las sesiones clave de trading (Sídney, Tokio, Londres, Nueva York AM/PM) como cuadros en el gráfico, muestra sus máximos/mínimos y niveles medios opcionales, y puede resaltar un rango de Balance Inicial (IB) dentro de cada sesión. También dibuja niveles de referencia clave de marcos temporales superiores — máximos y mínimos actuales y del día/semana/mes anterior — y los muestra tanto como líneas en el gráfico como en un panel compacto, para que siempre veas dónde está el precio en relación con los recientes grupos de liquidez.
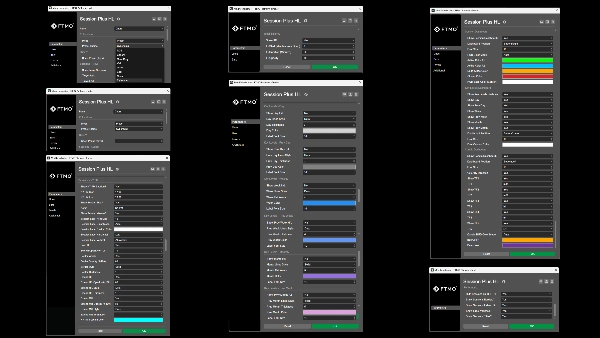
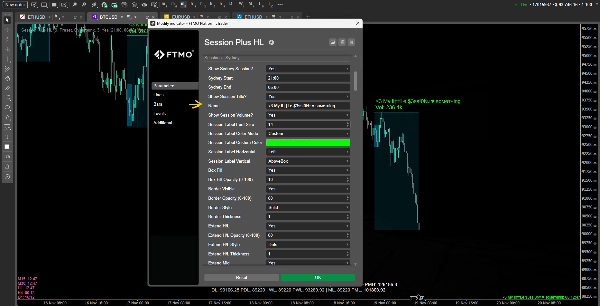
Además, el indicador proporciona varios HUDs: un panel de sesión que muestra cuánto tiempo queda hasta que cada sesión abra o cierre, un panel de niveles clave que resume todos los valores máximos/mínimos diarios/semanales/mensuales, y un panel de velas que muestra el tiempo restante en las velas de múltiples marcos temporales superiores y su estado alcista/bajista. Todos los elementos visuales son personalizables (preajustes de color o colores personalizados), pueden ajustarse para mejorar el rendimiento (ocultando sesiones en TF superiores, controlando los extremos de línea en lugar de extensiones dinámicas pesadas), y están diseñados para apoyar el análisis de barridos de liquidez, rangos de sesión y temporización sin saturar ni ralentizar el gráfico.
Resumen
Valoraciones de clientes
5 | 0 % | |
4 | 50 % | |
3 | 50 % | |
2 | 0 % | |
1 | 0 % |


![Logotipo de "Smart Money Concepts (SMC) [Iridio Capital]"](https://cdn.ctrader.com/image/webp/28b69fd1-ef54-4bed-9487-07e78e883be4_40934)


