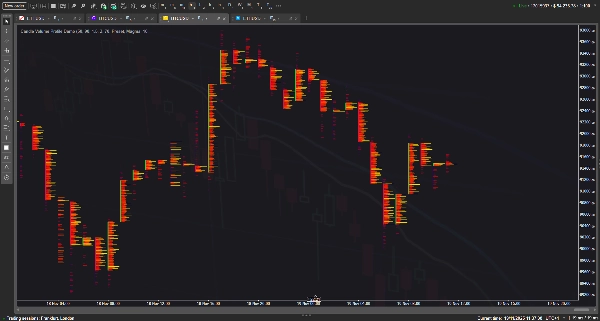
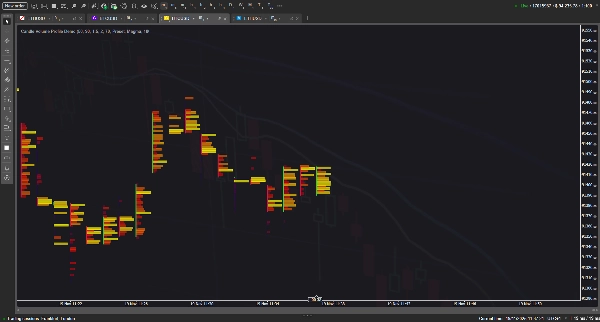
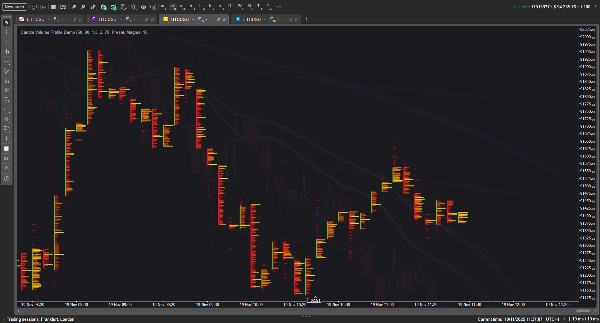
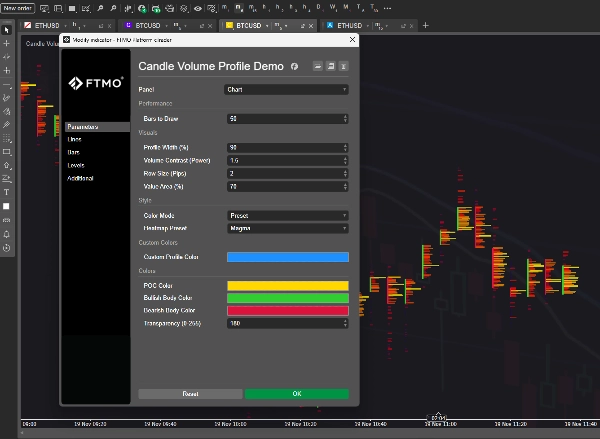
Candle Volume Profile Demo
Indicador
245 descargas
Version 1.0, Nov 2025
Windows, Mac
4.0
Valoraciones: 1
Imagen cargada de "Candle Volume Profile Demo"Imagen cargada de "Candle Volume Profile Demo"Imagen cargada de "Candle Volume Profile Demo"Imagen cargada de "Candle Volume Profile Demo"
Desde 26/05/2025
337.3M
Volumen operado
58.68K
Pips ganados
11
Ventas
900
Instalaciones gratis

This indicator visualizes the Volume Profile for individual bars, transforming standard candlesticks into a detailed 'footprint' style chart with customizable heatmaps, Point of Control (POC) lines, and Value Area blocks to highlight volume distribution per price level. It aims to emulate professional order flow tools by using heuristic volume distribution to render market activity directly on the chart.

Theoretically, this concept should work seamlessly to provide deep market insights; however, in practice, due to the immense number of graphical objects required for rendering, the more features and history depth you demand from this indicator, the more it tends to lag and cause terminal instability. :(

4.0
Valoraciones: 1
5
0 %
4
100 %
3
0 %
2
0 %
1
0 %
Valoraciones de clientes
November 24, 2025
Candle Volume Profile Demo gives you a clean visual of volume distribution inside candles/ranges - a smart add-on for liquidity-aware traders. The visualization is sharp and performance solid, but as a demo version it lacks full features (history logs, advanced filters). Best when paired with structure and confirmation tools. A good starting point, ready to level up.
VWAP
ZigZag
FVG
ATR
Signal
Crypto
BTCUSD

Más de este autor

Indicador
NAS100
Indices
Prop
+6
VolumeThermometer
Heatmap of intra-HTF volume (POC/VA) built from LTF tick data; paints current candle and auto-loads visible history.
Indicador
NAS100
NZDUSD
XAUUSD
+13
Side Volume Profile
Right-anchored cTrader Volume Profile with VAH/VAL/POC, LVZ, top volume+EMA, themes, and fast, readable visuals.
Indicador
NAS100
NZDUSD
XAUUSD
+12
VSA
Pro VSA tool with 3 modes: Fixed Ratios, Standard Deviation & Contextual VSA.
Candles_Painter
Overlay HTF context on any chart: color bars by HTF and draw filled HTF bodies with optional High/Low lines.
Moving Average Plus
10 configurable moving averages: choose type, period, color per line; single price source for all.
Indicador
NAS100
NZDUSD
Breakout
+19
Session Plus HL
Session boxes, liquidity sweeps and higher‑timeframe levels for intraday trading
Market Entropy
Market entropy + DC. Spot crystallization/chaos shifts with an optional on-chart overlay.
TrendStrengthSignals
Edge-aware clouds + Pro HUD: better entries, calmer exits, adaptive risk.
Indicador
NAS100
NZDUSD
XAUUSD
+16
Candle Timer Toolbox
A multi-TF panel with candle timers, sessions, ticker, spread & 15+ themes. Fully customizable.
Indicador
NAS100
NZDUSD
XAUUSD
+14
Donchian Channel Pro
Tracks N-period highs/lows, HTF overlay, HUDs with ADX, RSI, session clocks. Customizable for precise trading.

Puede interesarle

Indicador
Breakout
Forex
On Balance Volume
On Balance Volume (OBV) measures buying and selling pressure as a cumulative indicator.
Indicador
Indices
Breakout
Prop
+6
Price Level DWM BT
Price Level DWM BT
Indicador
NAS100
NZDUSD
XAUUSD
+11
ADXVMA Aurora Trend Filter
⚡ ADXVMA Aurora Trend Filter combines ADX trend strength with an adaptive EMA blend ⚡
Indicador
RSI
Signal
MACD
+1
Long Wick
Identify potential reversal points in the market by detecting candles with exceptionally long upper or lower wicks
Indicador
NAS100
NZDUSD
Martingale
+22
Candle Timer
Candle Timer best used for Scalper
Indicador
Indices
Forex
EURUSD
+2
US Dollar Index
US Dollar Index
Vishal Volume Profile v2.0
Volume Profile plots traded volume at each price level, highlighting high activity zones of precise support & resistance
Mejor valorado
Gratis
Indicador
Indices
RSI
Signal
Rsi + Volume
This indicator combines RSI (Relative Strength Index) with volume analysis to generate more reliable trading signals.
Indicador
NAS100
Indices
XAUUSD
+6
SessionGuard - Session High-Low Box
Visual session structure showing Asia, London and New York high/low ranges directly on the chart.
Indicador
Breakout
ATR
LT_SmartSwings
Detects swing highs/lows, structure, breakouts, trend lines, and fibs — great for price action trading.
Indicador
NAS100
NZDUSD
XAUUSD
+14
Previous HLOC
Previous HLOC – Smart Higher-Timeframe Levels for Precision Trading.
Indicador
RSI
Breakout
XAUUSD
+5
Zones Supply Demand
📊Zones Supply & Demand: Identifies key price levels with high volume concentration, marking Supply/Demand Zones & Marke
Desde 26/05/2025
337.3M
Volumen operado
58.68K
Pips ganados
11
Ventas
900
Instalaciones gratis