
Descripción
SmartFibonacci — Retrocesos y extensiones de Fibonacci automáticos y configurables con soporte para marcos temporales superiores, etiquetas de precios y alertas de proximidad para decisiones comerciales más rápidas y seguras.
Descripción corta lista para la tienda (1–2 líneas)
SmartFibonacci detecta automáticamente los puntos altos/bajos de oscilación y dibuja retrocesos claros de Fibonacci y extensiones opcionales en tu gráfico. La detección configurable de oscilaciones en marcos temporales superiores, etiquetas de precios/porcentajes y alertas de proximidad lo hacen ideal tanto para scalping intradía como para configuraciones de swing.
Descripción completa del producto (lista para copiar y pegar en la tienda cTrader)
SmartFibonacci es un indicador ligero y enfocado en el rendimiento para cTrader que automatiza el análisis de Fibonacci para que puedas dedicar menos tiempo a dibujar niveles y más tiempo a operar. Localiza el último máximo y mínimo de oscilación dentro de un periodo configurable, dibuja niveles de retroceso y niveles opcionales de proyección (extensión), y muestra etiquetas de precio y porcentaje para una interpretación rápida. Para señales robustas, SmartFibonacci puede calcular puntos de oscilación en un marco temporal superior mientras dibuja niveles en tu gráfico actual. Las alertas integradas (ventana emergente + sonido) te notifican cuando el precio se acerca a una distancia configurable en pips de cualquier nivel visible de Fibonacci.
Esta lista incluye: capturas de pantalla claras que muestran elementos clave de la interfaz, flujos de trabajo de ejemplo, configuraciones y salidas de muestra (etiquetas de precios, extensiones, alertas) para facilitar a los compradores la evaluación de la funcionalidad y la experiencia de usuario antes de la compra.
Características clave
- Detección automática de oscilaciones — encuentra el último máximo/mínimo de oscilación dentro de una ventana configurable.
- Opción de oscilación en marco temporal superior — calcula pivotes de oscilación en un marco temporal superior para niveles más suaves y significativos.
- Retrocesos y extensiones — dibuja líneas estándar de retroceso y niveles opcionales de proyección (extensión) (porcentajes definibles por el usuario como 127.2, 161.8, etc.).
- Etiquetas de precio y porcentaje — cada nivel visible muestra su porcentaje y el precio exacto para una toma de decisiones rápida.
- Visuales personalizables — configura colores (retroceso / extensión), grosor y estilo de línea.
- Alertas de proximidad — ventana emergente + sonido cuando el precio entra en un radio configurable de pips de un nivel visible de Fibonacci; opción para alertar solo el nivel más cercano.
- Lógica eficiente de redibujo — el indicador se redibuja solo cuando cambian los pivotes de oscilación para reducir el desorden en el gráfico y el uso de CPU.
- Valores predeterminados seguros — valores predeterminados sensatos para traders que desean uso inmediato tras la instalación.
- Compatible con cTrader / cAlgo — diseñado para funcionar como un indicador superpuesto.
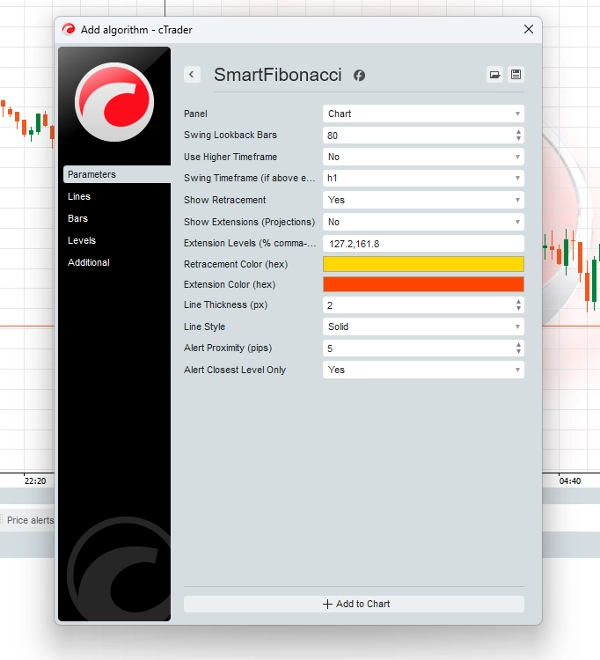
Configuración (parámetros y explicaciones)
- Barras de retroceso para oscilación (int) — cuántas barras buscar hacia atrás para encontrar el máximo/mínimo de oscilación (por defecto 80).
- Usar marco temporal superior (bool) — habilita la detección en un marco temporal superior mientras se dibuja en el gráfico actual.
- Marco temporal de oscilación (TimeFrame) — el marco temporal superior a usar cuando
Use Higher Timeframeestá habilitado. - Mostrar retroceso (bool) — alternar el dibujo de niveles de retroceso.
- Mostrar extensiones (bool) — alternar el dibujo de niveles de extensión/proyección.
- Niveles de extensión (string) — valores porcentuales separados por comas (p. ej.,
127.2,161.8) usados para poblar las líneas de proyección. - Color de retroceso / Color de extensión (hex) — elige colores para las líneas de retroceso y extensión.
- Grosor de línea (px) — configuración entera del grosor de línea.
- Estilo de línea (enum) — elige sólido, punteado, etc.
- Proximidad de alerta (pips) — distancia en pips para alertas de proximidad.
- Alertar solo nivel más cercano (bool) — cuando está habilitado, solo el nivel fib más cercano activa la ventana emergente.
Salidas analíticas y elementos UX
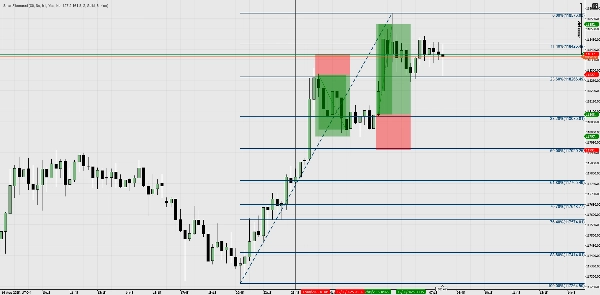
- Líneas en el gráfico — líneas de retroceso y extensión con etiquetas claras de porcentaje (p. ej., 61.8%) y etiquetas de precio (p. ej., 1.23456).
- Notificaciones emergentes — el usuario recibe una ventana emergente en pantalla y el sonido del sistema cuando el precio entra en el área de
Alert Proximity. - Redibujos no intrusivos — solo se actualiza cuando cambia la oscilación detectada para evitar parpadeos frecuentes.
- Consistencia en la fuente de precio — las alertas y etiquetas se calculan usando la misma serie de barras en la que se dibujó el fib (importante al usar cálculo en marcos temporales superiores).
Flujos de trabajo de ejemplo / escenarios de uso
- Configuración rápida (scalping / intradía)
-
- Adjunta SmartFibonacci a un gráfico de 5 minutos, configura
Lookback = 80,ShowRetrace = true. - Observa los niveles de retroceso y usa 61.8% / 50% como zonas de reacción intradía.
- Activa
Alert Proximity = 5 pipspara recibir notificaciones cuando el precio se acerque a niveles importantes.
- Adjunta SmartFibonacci a un gráfico de 5 minutos, configura
- Contexto de marco temporal superior (swing trading)
-
- Configura
Use Higher Timeframe = truey seleccionaHigher Timeframe = H4(o Diario). - Los niveles reflejan oscilaciones H4 mientras operas en H1 o M30 — mejor alineación con la estructura de TF superior.
- Usa extensiones (127.2, 161.8) como objetivos de ganancia para operaciones swing.
- Configura
- Validación + confluencia
-
- Combina niveles de SmartFibonacci con tu soporte/resistencia existente, rupturas de estructura o medias móviles para validar entradas.
- Usa las alertas emergentes para cronometrar entradas o registra las interacciones para pruebas retrospectivas.
- Flujos de trabajo basados en alertas
-
- Mantén el indicador activo mientras monitoreas múltiples gráficos; recibe ventanas emergentes cuando el precio se acerca a cualquier nivel fib visible configurado y actúa en consecuencia.
Resumen
Valoraciones de clientes
5 | 100 % | |
4 | 0 % | |
3 | 0 % | |
2 | 0 % | |
1 | 0 % |


![Logotipo de "High-Low Divergence [Iridio Capital]"](https://cdn.ctrader.com/image/webp/443c4661-7abb-40f1-842f-4b6ec560649b_40914)


![Logotipo de "[Hamster-Coder] Pivot Points MTF"](https://cdn.ctrader.com/image/webp/4c143e5a-309c-40e3-a578-f04d1e133ffa_31159)


