
Descripción
Indicador Mejorado de Soporte y Resistencia
Desbloquee el poder del análisis técnico con nuestro Indicador Mejorado de Soporte y Resistencia para cAlgo. Esta herramienta avanzada está diseñada para ayudar a los traders a identificar y visualizar niveles críticos de soporte y resistencia en sus gráficos de trading, mejorando la toma de decisiones y las estrategias de trading.
Características clave:
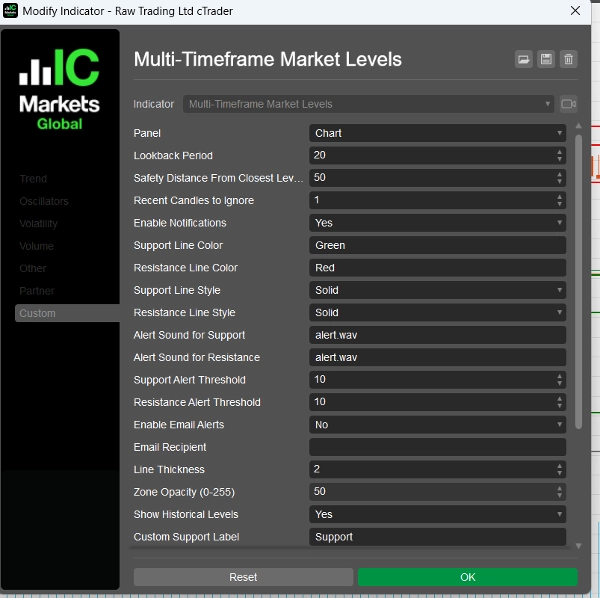
- Parámetros Personalizables: Adapte el indicador a su estilo de trading con configuraciones ajustables, incluyendo períodos de retroceso, distancias de seguridad, sonidos de alerta y más.
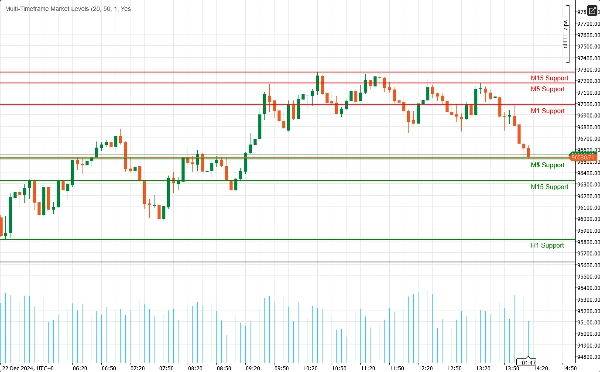
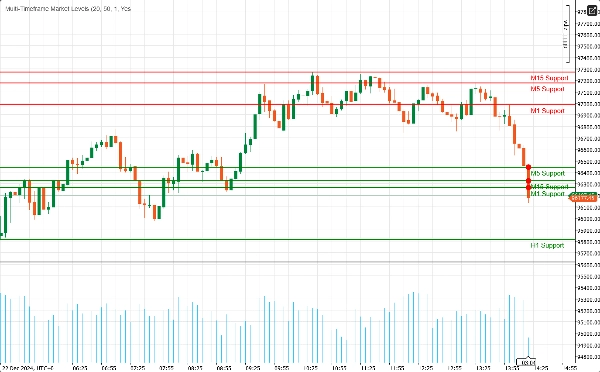
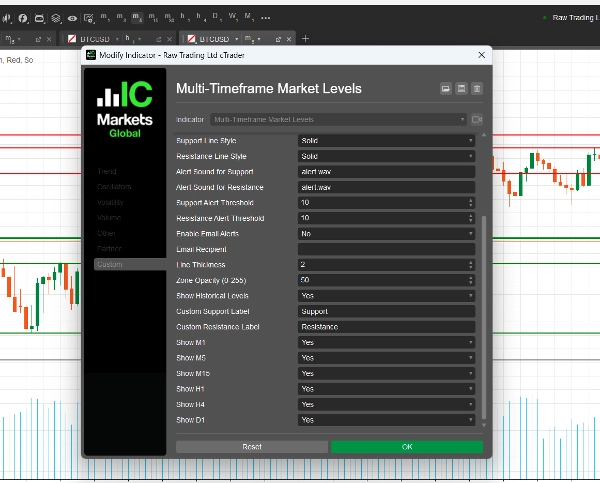
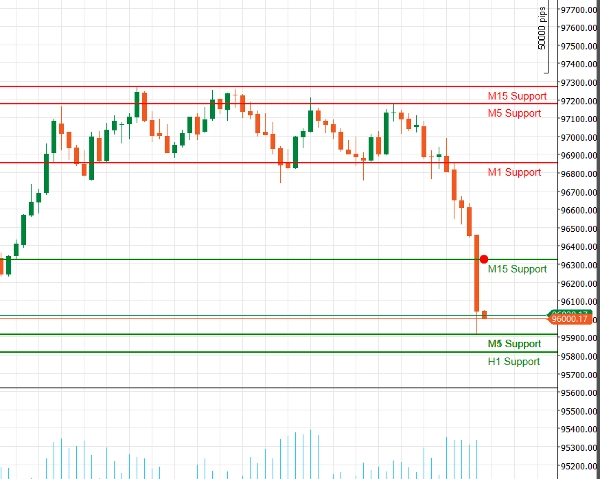
- Soporte Multitemporal: Analice múltiples marcos temporales simultáneamente (M1, M5, M15, H1, H4, D1) para obtener una visión completa de la dinámica del mercado e identificar niveles clave en diferentes horizontes de trading.
- Alertas en Tiempo Real: ¡Manténgase informado con notificaciones instantáneas! El indicador puede enviar alertas de audio y notificaciones por correo electrónico cuando el precio se acerca a niveles críticos de soporte o resistencia, asegurando que nunca pierda una oportunidad de trading.
- Claridad Visual: Disfrute de representaciones visuales claras de los niveles de soporte y resistencia, completas con colores y estilos de línea personalizables. Las zonas resaltadas proporcionan contexto adicional, facilitando la identificación de posibles puntos de reversión.
- Integración de Fibonacci: Mejore su análisis con el dibujo integrado de niveles de Fibonacci, que le permite identificar niveles potenciales de retroceso y extensión junto con soporte y resistencia.
- Interfaz Fácil de Usar: Diseñado tanto para traders novatos como experimentados, el indicador es fácil de configurar e integra perfectamente en su entorno cAlgo existente.
Cómo usar el Indicador Mejorado de Soporte y Resistencia
- Instalación:
-
- Descargue el indicador e impórtelo en su plataforma cAlgo.
- Adjunte el indicador al gráfico deseado.
- Configurar Parámetros:
-
- Ajuste las configuraciones para adaptarlas a su estilo de trading. Establezca el período de retroceso, la distancia de seguridad y elija sus colores y estilos de línea preferidos para los niveles de soporte y resistencia.
- Active las notificaciones si desea recibir alertas cuando el precio se acerque a estos niveles.
- Seleccionar Marcos Temporales:
-
- Elija qué marcos temporales desea mostrar. Puede optar por mostrar u ocultar niveles de M1, M5, M15, H1, H4 y D1, según su estrategia de trading.
- Analizar el Gráfico:
-
- Observe los niveles de soporte y resistencia dibujados en su gráfico. Estos niveles indican dónde es probable que el precio se revierta o consolide.
Cómo operar con el Indicador Mejorado de Soporte y Resistencia
- Identificación de Puntos de Entrada:
-
- Operaciones en Largo: Busque oportunidades de compra cuando el precio se acerque a un nivel de soporte, especialmente si muestra señales de rebote (por ejemplo, patrones de velas alcistas).
- Operaciones en Corto: Considere vender cuando el precio se acerque a un nivel de resistencia, particularmente si hay señales bajistas (por ejemplo, patrones de velas bajistas).
- Uso de Alertas:
-
- Utilice las alertas en tiempo real para notificarle cuando el precio se acerque a niveles clave de soporte o resistencia. Esto le permite actuar rápidamente y aprovechar oportunidades potenciales de trading.
- Combinación con Otros Indicadores:
-
- Mejore su estrategia combinando el Indicador Mejorado de Soporte y Resistencia con otros indicadores técnicos (por ejemplo, Medias Móviles, RSI, MACD) para confirmar señales y mejorar la precisión de sus operaciones.
- Establecer Niveles de Stop-Loss y Take-Profit:
-
- Coloque órdenes de stop-loss justo por debajo de los niveles de soporte para operaciones en largo y justo por encima de los niveles de resistencia para operaciones en corto para gestionar el riesgo.
- Establezca objetivos de take-profit en el siguiente nivel significativo de soporte o resistencia para maximizar las ganancias potenciales.
¿Por qué elegir el Indicador Mejorado de Soporte y Resistencia?
Navegar por las complejidades de los mercados financieros puede ser un desafío. El Indicador Mejorado de Soporte y Resistencia le proporciona las herramientas necesarias para identificar niveles clave de precio y tomar decisiones de trading informadas. Ya sea que sea un trader diario o un inversor a largo plazo, este indicador es una adición esencial a su conjunto de herramientas de trading.
Resumen
Valoraciones de clientes
5 | 100 % | |
4 | 0 % | |
3 | 0 % | |
2 | 0 % | |
1 | 0 % |


