
ICT Killzones
インジケーター
13 購入済
バージョン 1.0、Oct 2025
Windows、Mac
4.0
レビュー: 4
説明
ICTキルゾーン完全版 – プロフェッショナルトレーディングセッション分析
cTrader用の最も包括的なICTキルゾーンインジケーターで、機関投資家の取引タイミングをマスターしましょう。このプロフェッショナルグレードのツールは、5つの重要なICT(Inner Circle Trader)取引セッションを自動的に識別し、視覚化します。これにより、スマートマネーと共に取引する優位性を得られます。
このバージョンの新機能:
- 全5つのICTセッション:アジアンレンジ、ロンドンキルゾーン、ニューヨークキルゾーン、NYランチ/リバーサルゾーン、NY午後キルゾーンを含む完全カバー
- スマートカラ―システム:複雑なARGBコードの代わりにシンプルな色名(赤、青、オレンジ)を使用
- 独立した透明度コントロール:各セッションの不透明度を調整可能(0-100%)
- セッション別ラベルカラー:ゾーンカラーとは独立してラベルカラーをカスタマイズ可能
- セッション説明:各セッションの特徴を説明するオプションの情報ラベル
- パフォーマンス向上:古いゾーンの自動クリーンアップを含む最適化コード
主な特徴:
📊 完全なセッションカバー:
- アジアンレンジ(19:00-00:00 NY):後のレイドのための統合ゾーンと流動性プールを識別
- ロンドンキルゾーン(02:00-05:00 NY):ストップハントやリバーサルに理想的な主要なボラティリティスパイクをマーク
- NYキルゾーン(07:00-10:00 NY):強いモメンタムを伴う2番目の主要な動きをハイライト
- NYランチゾーン(12:00-13:30 NY):リバーサルと統合期間を表示
- NY午後キルゾーン(13:30-16:00 NY):二次的な動きと市場のリバランスをキャプチャ
🎨 簡単なカラーカスタマイズ:
- シンプルな色名:単に「Blue」「Orange」「Purple」などと入力
- DodgerBlue、BlueViolet、MediumAquamarineなど50以上のプリセットカラー
- 16進カラーサポート(#RRGGBB形式)
- 各ゾーンごとの個別透明度スライダー(0-100%)
- 最大の明瞭さのための別々のラベルカラー
⚙️ 強力な表示オプション:
- 個別セッションのオン/オフ切り替え
- セッション情報ラベルの表示/非表示
- 調整可能なフォントサイズ(6-20)
- ゾーンをチャート端まで拡張するか、範囲内に保持するか選択可能
- 表示する履歴の日数を制御(1-30日)
- 自動クリーンアップでチャートの乱雑さを防止
🎯 プロフェッショナルデザイン:
- クリーンで邪魔にならない視覚化
- アクティブセッション中の動的な高値/安値追跡
- オーバーナイトセッションの適切な処理
- すべてのタイムフレームで動作
- ゼロラグ、最適化されたパフォーマンス
理想的な用途:
- 精密なタイミングを求めるICTメソドロジートレーダー
- 機関投資家のフローに従うスマートマネートレーダー
- 正確なセッション境界を必要とするデイトレーダーやスキャルパー
- 主要なリバーサルゾーンを特定するスイングトレーダー
- 主要な市場セッションに合わせて取引したいすべての人
仕組み:
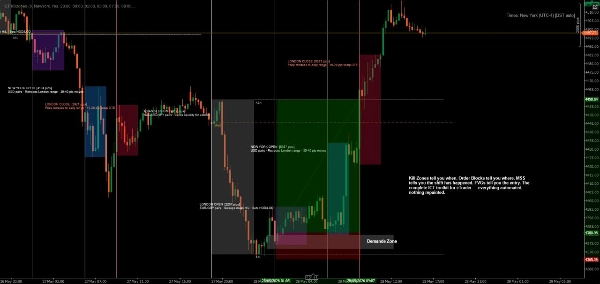
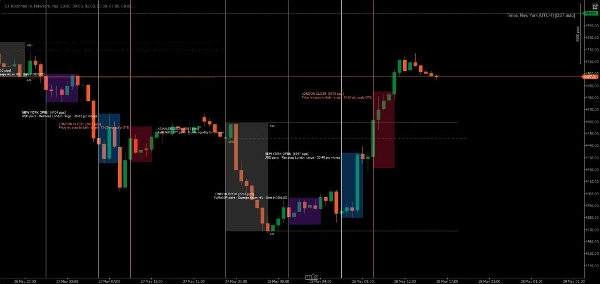
インジケーターは各取引日を自動的に検出し、5つのICTセッションすべてのために色分けされたゾーンを作成します。価格が各セッションを通過するにつれて、インジケーターは高値と安値を追跡し、セッション終了時に最終ゾーンを描画します。ラベルは各セッションを明確に識別し、オプションでその取引特性を表示します。
すべての時間はニューヨーク(東部)時間で、標準のICTメソドロジーに従っています。
カスタマイズ例:
- 保守的セットアップ:低透明度(20-30%)、控えめな色、セッション情報なし
- 大胆なセットアップ:高透明度(70-80%)、鮮やかな色、完全なセッション説明
- ミニマルセットアップ:不要なセッションをオフにし、好みのキルゾーンのみを保持
- 色分け戦略:取引バイアスに合わせてゾーンカラーを設定(緑=ロング、赤=ショート)
システム要件:
- プラットフォーム:cTraderデスクトップ(cTraderストア製品はWebまたはモバイル版ではサポートされていません) blog.ctrader.com
- オペレーティングシステム:Windows 7以上
- プロセッサー:デュアルコアCPU推奨
- メモリ:最低2GB RAM(推奨4GB)
- インターネット接続:毎秒50kB以上の速度
インストール手順:
- 購入/インストール:cTraderストアからインジケーターを入手
- cTraderデスクトップをダウンロード:未インストールの場合は ctrader.com からダウンロード
- ログイン:cTraderデスクトップを開き、cTrader IDでサインイン
- インジケーターにアクセス:「Algo」セクション → 「Indicators」リストへ移動
- チャートに追加:任意のチャートを右クリック → 「Indicators」 → 「ICT Killzones Complete」を選択
- カスタマイズ:チャート上のインジケーター名を右クリック → 「Settings」で色、時間、表示オプションを調整
最良の結果を得るためのヒント:
- 最適な視認性のために1分から1時間のタイムフレームで使用
- 価格アクションと流動性の概念と組み合わせて最良の結果を
- ブローカーが異なるタイムゾーンを使用している場合はセッション時間を調整
- 透明度を調整して最適な視覚バランスを見つける
- 学習時はセッション情報ラベルを有効にし、チャートをすっきりさせたい場合は無効に
正確に取引し、自信を持って取引し、ICT方式で取引しましょう。
注意:このインジケーターは教育および情報提供目的のものです。過去のパフォーマンスは将来の結果を保証するものではありません。常に適切なリスク管理を行ってください。
概要
AIによる概要
ICT Killzones Complete is a professional indicator for the cTrader Desktop platform designed to identify and visualize five key trading sessions based on the Inner Circle Trader (ICT) methodology. It automatically detects daily trading periods in New York (Eastern) time and marks the Asian Range, London Kill Zone, New York Kill Zone, New York Lunch/Reversal Zone, and New York PM Kill Zone on the chart. Each session is color-coded with easy-to-use color names and supports over 50 predefined colors plus hex color codes. Users can independently adjust the transparency and label colors for each session, toggle sessions on or off, and display optional session information labels explaining trading characteristics.
The indicator tracks high and low prices during active sessions and finalizes zones upon session close, providing clear visual boundaries for institutional trading timing. It supports all timeframes, handles overnight sessions properly, and includes automatic cleanup of old zones to maintain chart clarity. Customization options include font size adjustment, zone extension control, and history length for displayed zones. ICT Killzones Complete is suitable for traders using ICT methodology, smart money concepts, scalping, day trading, and swing trading across markets such as Forex, commodities, and crypto. It requires cTrader Desktop on Windows 7 or higher with recommended hardware specifications.
The indicator tracks high and low prices during active sessions and finalizes zones upon session close, providing clear visual boundaries for institutional trading timing. It supports all timeframes, handles overnight sessions properly, and includes automatic cleanup of old zones to maintain chart clarity. Customization options include font size adjustment, zone extension control, and history length for displayed zones. ICT Killzones Complete is suitable for traders using ICT methodology, smart money concepts, scalping, day trading, and swing trading across markets such as Forex, commodities, and crypto. It requires cTrader Desktop on Windows 7 or higher with recommended hardware specifications.
インジケーターのプロフィール
カスタマーレビュー
4.0
レビュー: 4
5 | 50 % | |
4 | 25 % | |
3 | 0 % | |
2 | 25 % | |
1 | 0 % |
カスタマーレビュー
June 15, 2026
Hi author, thanks for sharing this indicator. However, after extensive testing, there are two major logical flaws that make it unusable for international traders in different timezones: Hardcoded Timezone (UTC/GMT Offset Bug): The indicator doesn't adapt to the user's local chart timezone settings (e.g., UTC+3 or UTC-4). It seems to force an internal UTC+0 calculation, causing the plotted session boxes to shift unexpecte
November 9, 2025
ICT Killzones nails the key trading hours - London, New York, Asia. Clean visuals, zero lag, and great for planning intraday plays. Ideal for ICT and SMC traders looking to time the market’s true volatility zones.
October 14, 2025
half size is enough at the start. It gives the trader a reason to pause.
October 13, 2025
The best part is it makes weak ideas easier to leave alone, and a small account test feels safer.
ディスカッション
よくあるご質問
Forex
Scalping
Commodities
SMC
Crypto
AI
XAUUSD
cTrader Storeで入手可能な取引ボット、インジケーター、プラグインなどの商品は、第三者の開発者が提供するものであり、情報と技術の取得のみを目的としてご利用いただけます。cTrader Storeはブローカーではなく、投資助言や個人的な推奨を行うことも、将来のパフォーマンスを保証することもありません。


![「[CB] Pivot Points Pro」ロゴ](https://cdn.ctrader.com/image/webp/43463c82-67b0-4f10-a4ba-901bba091d81_32594)


価格
登録日 22/11/2024
140
販売
2.61K
無料インストール