
説明
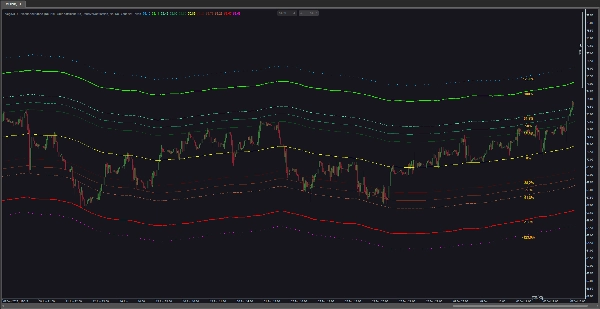
cTrader用のダイナミックなフィボナッチチャネルインジケーターをお探しなら、これ以上探す必要はありません。このインジケーターは、選択した移動平均線に平行なフィボナッチバンドを自動的に描画します。使いやすく、他のインジケーターと同様に、ポップアップ、サウンド、メール、Telegramメッセージによるアラートを提供します。さらに、バンド、フィボナッチレベル、アラートを自由にカスタマイズできます。
主な機能一覧:
- フィボナッチバンドの計算:選択した移動平均線に基づいてフィボナッチバンドを計算し描画します。これらのバンドはフィボナッチレベル(例:0.0%、38.2%、61.8%など)から派生し、指定された係数で移動平均線の上下に拡張されます。
- 移動平均の設定:移動平均の種類(例:単純移動平均、指数移動平均など)や計算に使用する期間数をカスタマイズできます。移動平均線はフィボナッチバンドの基礎となります。
- アラート機能:特定のイベントをトレーダーに通知するための様々なアラートオプションを提供します。価格レベルのタッチアラートや近接アラートが含まれます。
- 価格レベルタッチアラート:価格が特定のフィボナッチレベルに触れたときにアラートを発生させるよう設定できます。アラートは終値ベースまたは価格がレベルに触れた瞬間に発生させることが可能です。
- 近接アラート:価格が指定したフィボナッチレベルに一定の距離内で近づいたり離れたりしたときに通知を受け取るためのアラートを設定できます。価格がレベルに近づく場合や離れる場合にアラートを発動させることができます。
- アラート出力オプション:サウンドアラート、ポップアップ、Telegramメッセージ、メール通知から選択可能です。サウンドアラートは異なる音声ファイルを選択してカスタマイズできます。
- 視覚化オプション:フィボナッチレベルの視覚化をカスタマイズできます。パーセンテージ値の表示、パーセンテージラベルの色設定、チャート上のラベル位置の制御、特定バンドの有効/無効切り替え、バンドの色、太さ、外観の選択などが可能です。
- 設定可能なフィボナッチレベル:計算に使用する特定のフィボナッチレベルを調整して、取引戦略に合わせてインジケーターをカスタマイズできます。正のフィボナッチレベルと負のフィボナッチレベルは個別に設定可能です。
- 内蔵ユーザーガイド:このインジケーターのユーザーガイドにチャートから直接アクセスできます。
まとめると、VegaXLR - Fibonacci Bandsインジケーターはフィボナッチ分析と移動平均を組み合わせて、潜在的なサポートおよびレジスタンスレベルの特定を支援します。設定可能なアラート機能と視覚化オプションを備え、フィボナッチのリトレースメントやエクスパンションに依存するトレーダーにとって非常に有用なツールです。
概要
AIによる概要
VegaXLR - Fibonacci Bands is a dynamic indicator for cTrader that automatically plots customizable Fibonacci bands parallel to a user-selected moving average. Traders can configure the moving average type (e.g., Simple, Exponential) and periods, which serve as the basis for the Fibonacci bands derived from adjustable Fibonacci levels (such as 0.0%, 38.2%, 61.8%, and others). The indicator supports both positive and negative Fibonacci levels, allowing tailored analysis.
It features multiple alert options including price level touch alerts—triggered on price contact or close at specified Fibonacci levels—and proximity alerts that notify when price approaches or moves away from these levels within a defined range. Alerts can be delivered via pop-up, sound (with customizable sounds), email, and Telegram messages.
Visualization settings enable customization of band colors, thickness, label display and position, and selective enabling or disabling of bands. A built-in user guide is accessible directly from the chart for ease of use.
Overall, VegaXLR - Fibonacci Bands combines Fibonacci retracement and expansion analysis with moving averages to assist traders in identifying potential support and resistance zones, enhanced by configurable alerts and visualization options.
インジケーターのプロフィール
カスタマーレビュー
5.0
レビュー: 2
5 | 100 % | |
4 | 0 % | |
3 | 0 % | |
2 | 0 % | |
1 | 0 % |
カスタマーレビュー
February 23, 2025
the setup gets a moment before execution, but a real person still needs review the setup.
February 19, 2025
ディスカッション
よくあるご質問
Forex
cTrader Storeで入手可能な取引ボット、インジケーター、プラグインなどの商品は、第三者の開発者が提供するものであり、情報と技術の取得のみを目的としてご利用いただけます。cTrader Storeはブローカーではなく、投資助言や個人的な推奨を行うことも、将来のパフォーマンスを保証することもありません。
この作成者の他の商品


価格
231
販売
692
無料インストール